Fig. 5.
Download original image
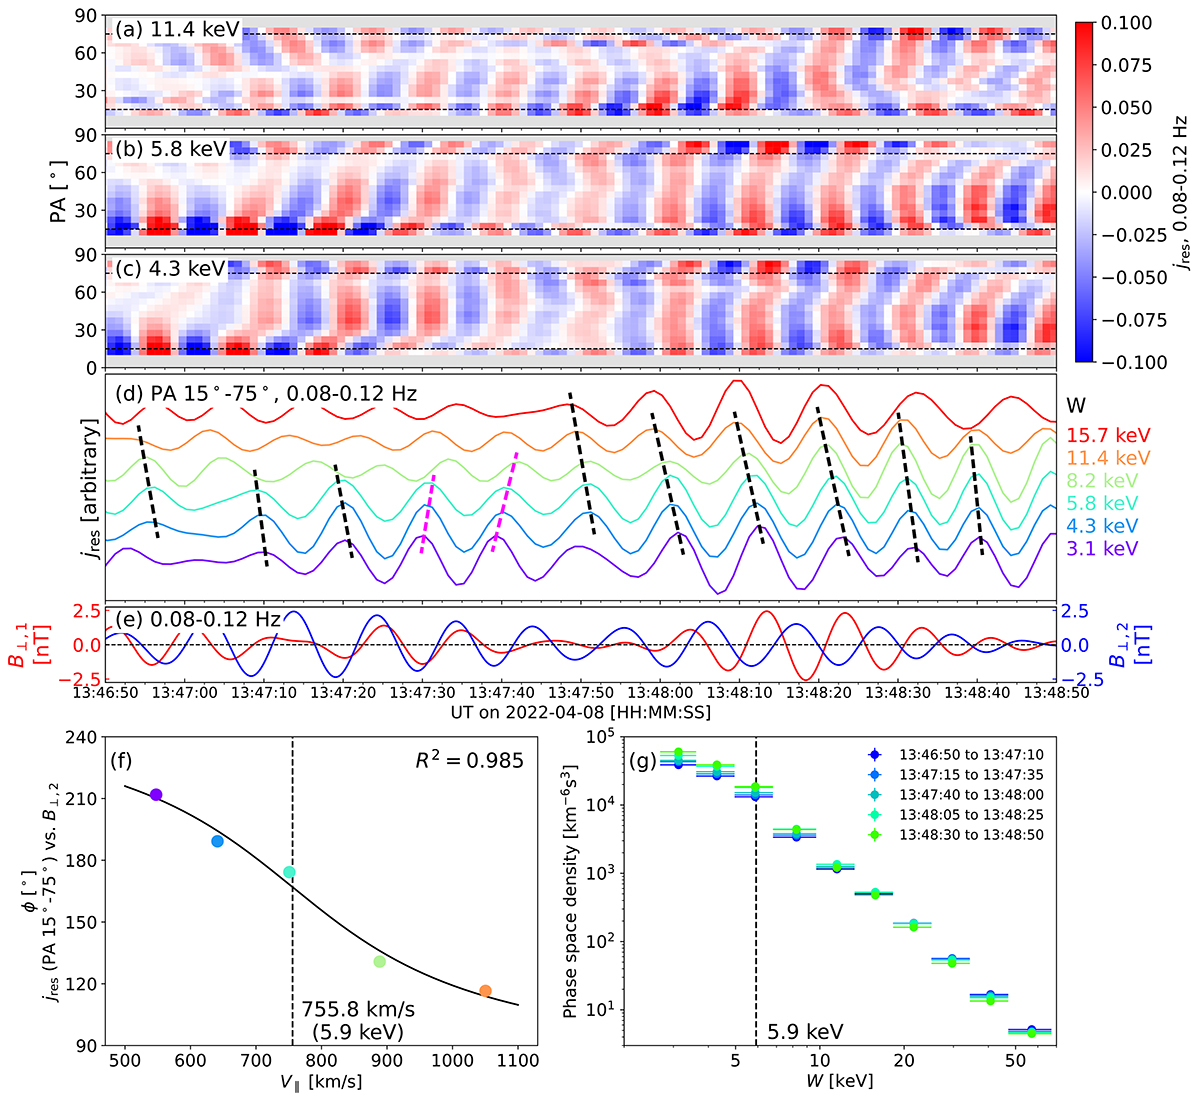
Resonance signatures in the residual flux. (a–c) 0.08–0.12 Hz band-pass filtered PADs of (a) 11.4 keV, (b) 5.8 keV and (c) 4.3 keV proton residual fluxes in the solar wind frame between 13:46:50–13:48:50 UT, derived from STEP measurements. The horizontal dashed black lines in (a–c) refer to the PA range of 15°–75°. (d) Stacked plots of band-pass filtered residual fluxes for 3.1–15.7 keV protons averaged between 15°–75° PA. The inclined black and dashed magenta lines are used to guide the eye. (e) 0.08–0.12 Hz band-pass filtered magnetic field B⊥, 1 and B⊥, 2 components in the mean (30 s) field-aligned coordinates. (f) Phase difference between the residual flux and B⊥, 2 for each energy channel presented in (d) averaged between 13:46:50–13:48:50 UT, calculated by the cross-wavelet analysis described in Grinsted et al. (2004). The colored dots correspond to the energy channels in (d). The black curve shows the least squares fit of ![]() , in which ϕ and V∥ are the phase difference and the parallel velocity, and a, VR, ϕ0 are free parameters. The vertical dashed line presents the VR derived from the fitting procedure. (g) Energy Spectra of time-averaged proton phase space density averaged over 15°–75° PA. The vertical dashed line marks the energy corresponding to VR.
, in which ϕ and V∥ are the phase difference and the parallel velocity, and a, VR, ϕ0 are free parameters. The vertical dashed line presents the VR derived from the fitting procedure. (g) Energy Spectra of time-averaged proton phase space density averaged over 15°–75° PA. The vertical dashed line marks the energy corresponding to VR.
Current usage metrics show cumulative count of Article Views (full-text article views including HTML views, PDF and ePub downloads, according to the available data) and Abstracts Views on Vision4Press platform.
Data correspond to usage on the plateform after 2015. The current usage metrics is available 48-96 hours after online publication and is updated daily on week days.
Initial download of the metrics may take a while.