Fig. 4.
Download original image
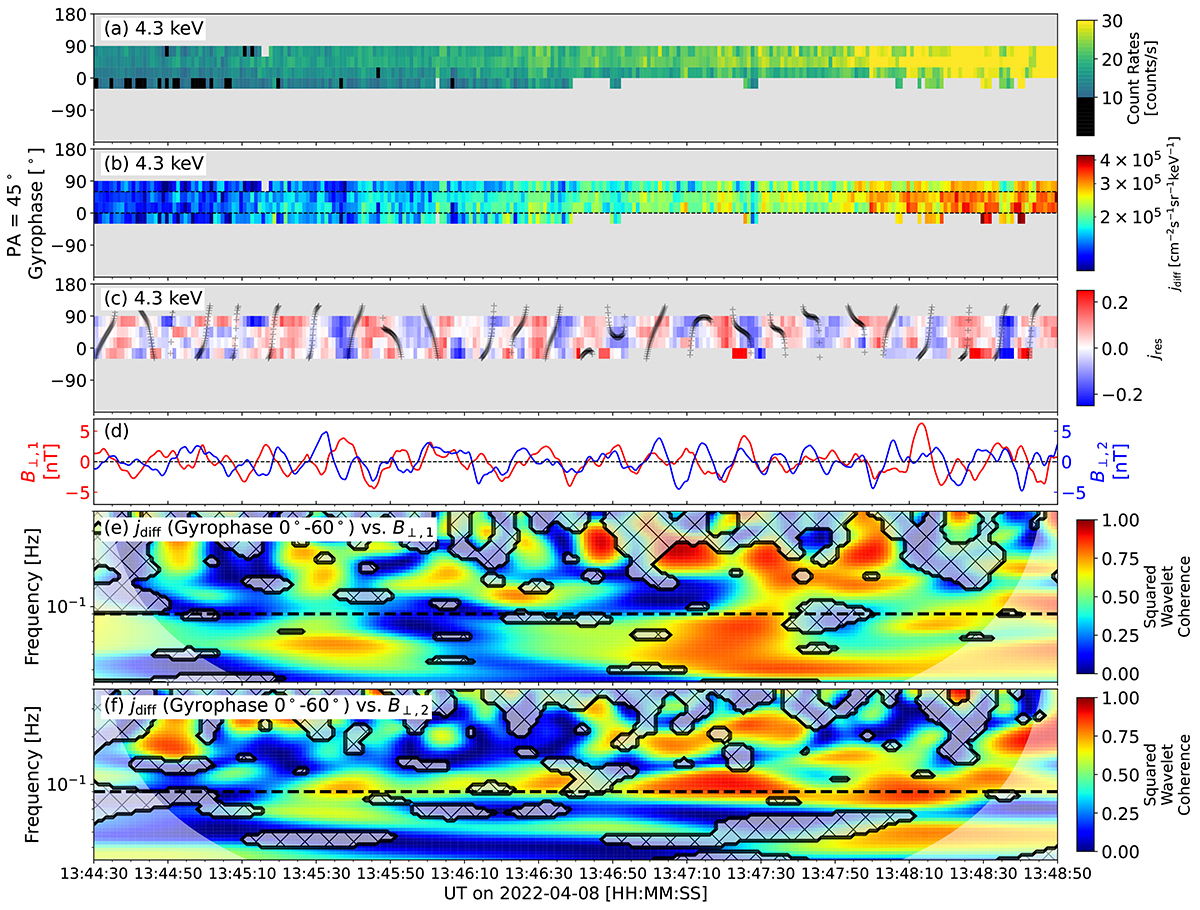
Signatures relevant to wave modulation. (a) Gyrophase distribution of 4.3 keV, 45° PA proton’s count rates in the solar wind frame, derived from STEP data. (b) Gyrophase distribution of 4.3 keV, 45° PA proton’s differential fluxes. The horizontal dashed black lines refer to the gyrophase range of 0°–60°. (c) Residual gyrophase distribution corresponding to (b). The residual flux is defined as: ![]() , where j0 is a 30 s running average of jdiff. The plus signs give the gyrophase of the magnetic wave (processed with a 0.08–0.12 Hz band-pass filter) field (Bw) between −30°–120°, which is defined as
, where j0 is a 30 s running average of jdiff. The plus signs give the gyrophase of the magnetic wave (processed with a 0.08–0.12 Hz band-pass filter) field (Bw) between −30°–120°, which is defined as ![]() . (d) Two perpendicular magnetic field components in the mean (30 s) field-aligned coordinates. Data presented in (c–d) are smoothed with a 5 s moving-window. (e–f) The squared wavelet coherence between 0°–60° gyrophase, 45° PA proton differential flux and (e) B⊥, 1, (f) B⊥, 2 in the mean-field-aligned coordinates. The “cross-hatched” areas mark the regions where the PSD of the corresponding magnetic field component is lower than 10 nT2/Hz. The dashed lines mark the frequency of 0.09 Hz.
. (d) Two perpendicular magnetic field components in the mean (30 s) field-aligned coordinates. Data presented in (c–d) are smoothed with a 5 s moving-window. (e–f) The squared wavelet coherence between 0°–60° gyrophase, 45° PA proton differential flux and (e) B⊥, 1, (f) B⊥, 2 in the mean-field-aligned coordinates. The “cross-hatched” areas mark the regions where the PSD of the corresponding magnetic field component is lower than 10 nT2/Hz. The dashed lines mark the frequency of 0.09 Hz.
Current usage metrics show cumulative count of Article Views (full-text article views including HTML views, PDF and ePub downloads, according to the available data) and Abstracts Views on Vision4Press platform.
Data correspond to usage on the plateform after 2015. The current usage metrics is available 48-96 hours after online publication and is updated daily on week days.
Initial download of the metrics may take a while.