Fig. 1.
Download original image
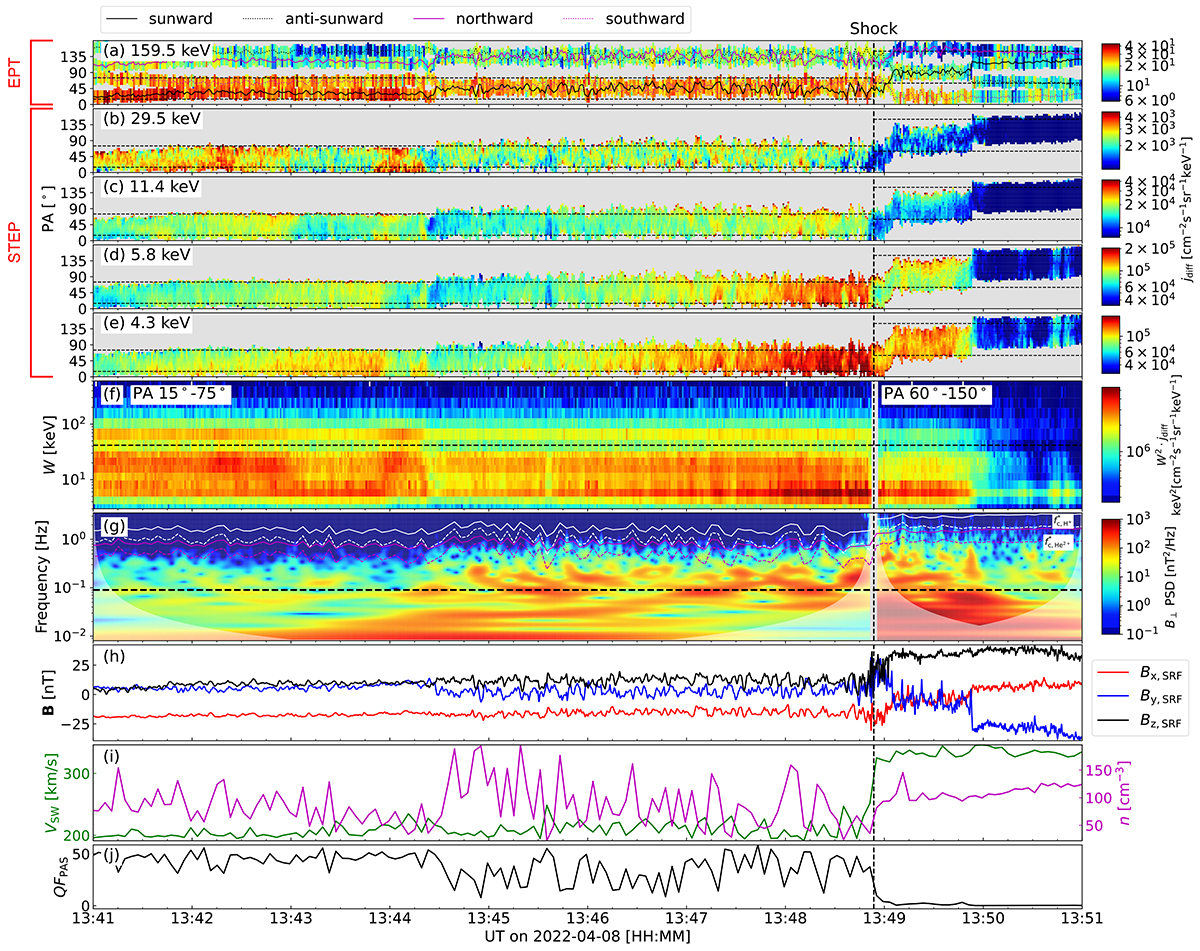
Overview of the April 8, 2022, shock event between 13:41–13:51 UT. (a–e) PADs of (a) 159.5 keV, (b) 29.5 keV, (c) 11.4 keV, (d) 5.8 keV and (e) 4.3 keV protons in the solar wind frame of reference, derived from data obtained by the EPD, the MAG and the SWA. (a) uses data measured by the EPT sensor of the EPD, and (b–e) use data acquired by the STEP sensor. The solid black curve, the dashed black curve, the solid magenta curve and the dashed magenta curve in (a) give the viewing directions of the sunward, the anti-sunward, the northward and the southward telescopes in PA, respectively. The horizontal dashed black lines in (a–e) refer to the PA ranges of 15°–75° (before the shock) and 60°–150° (after the shock), in which the data are used to produce the energy-time spectrogram in (f). (f) The energy-time spectrogram of 15°–75° (before the shock) and 60°–150° (after the shock) PA protons. The color code in (f) represents proton differential fluxes (jdiff) multiplied by the square of energies (W). The horizontal dashed black line in (f) marks the boundary between the STEP and EPT energy ranges. (g) The frequency-time spectrogram of the perpendicular magnetic field mean-field-transformed wavelet power spectral density (PSD), derived from MAG observations. The white curves and the magenta curves in (g) give equivalent local cyclotron-frequencies for protons (fc, H+*) and α-particles (fc, He2+*) Doppler-shifted into the spacecraft frame, respectively. The solid curves represent the assumption of outward-propagating waves and the dashed curves suggest the situation of inward-propagating waves. The horizontal dashed white line in (g) marks the frequency of 0.09 Hz. The white shades illustrate the cones-of-influence of the wavelet transformation. (h) The magnetic field components in the spacecraft frame, measured by MAG. (i) The solar wind proton bulk speed (the green curve) and density (the magenta curve), measured by the PAS sensor of the SWA. (j) The quality factor (QFPAS) of PAS ground-calculated moments data. The vertical dashed black line indicates the arrival time of the shock (13:48:53 UT).
Current usage metrics show cumulative count of Article Views (full-text article views including HTML views, PDF and ePub downloads, according to the available data) and Abstracts Views on Vision4Press platform.
Data correspond to usage on the plateform after 2015. The current usage metrics is available 48-96 hours after online publication and is updated daily on week days.
Initial download of the metrics may take a while.