Fig. 6
Download original image
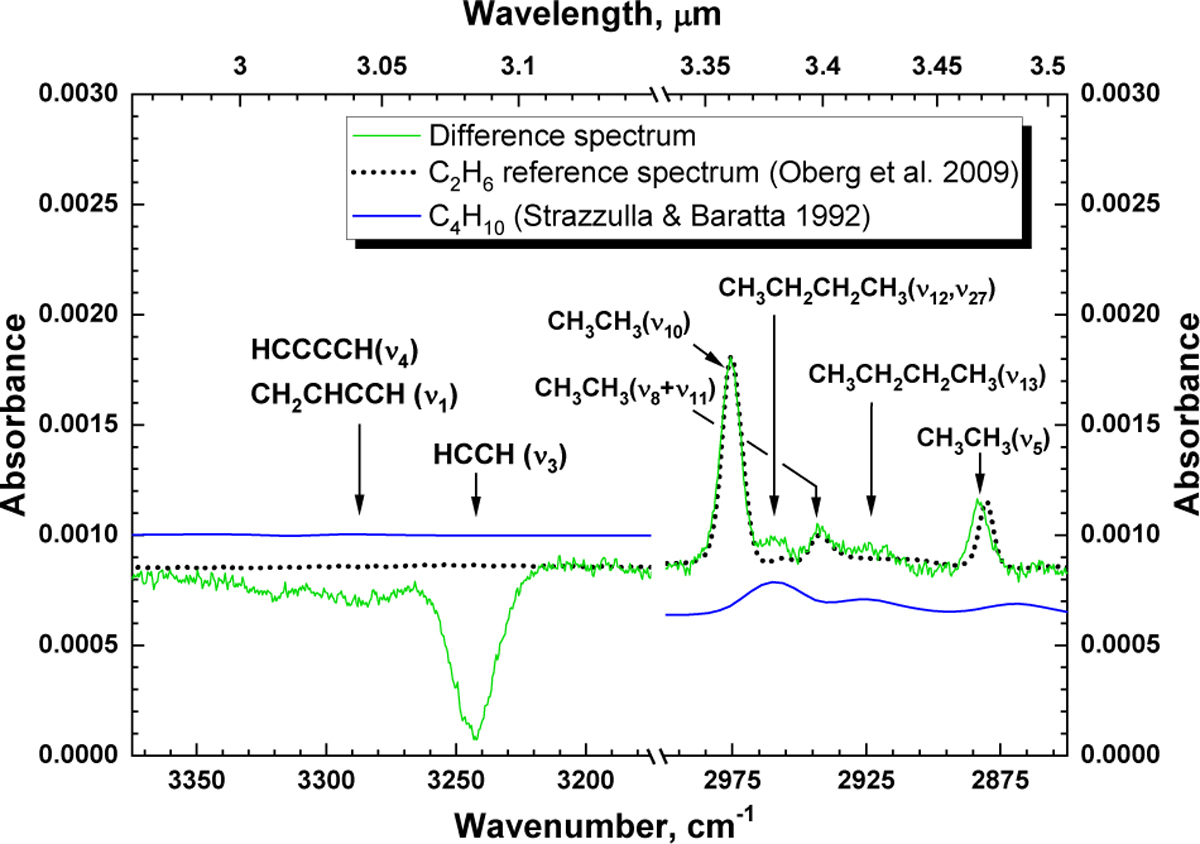
Zoom-in into the CH stretching vibration modes region for the RAIR difference spectrum obtained after hydrogenation of UV-exposed C2H2 ice (green line). See the right panel of Fig. 5 for more details. The spectrum of pure C2H6 ice at 20 K is adapted from Öberg et al. (2009) (black dots). The spectrum of pure C4H10 at 10 K is obtained by Strazzulla & Baratta (1992) (blue line). All spectra are offset for clarity.
Current usage metrics show cumulative count of Article Views (full-text article views including HTML views, PDF and ePub downloads, according to the available data) and Abstracts Views on Vision4Press platform.
Data correspond to usage on the plateform after 2015. The current usage metrics is available 48-96 hours after online publication and is updated daily on week days.
Initial download of the metrics may take a while.