Fig. B.1
Download original image
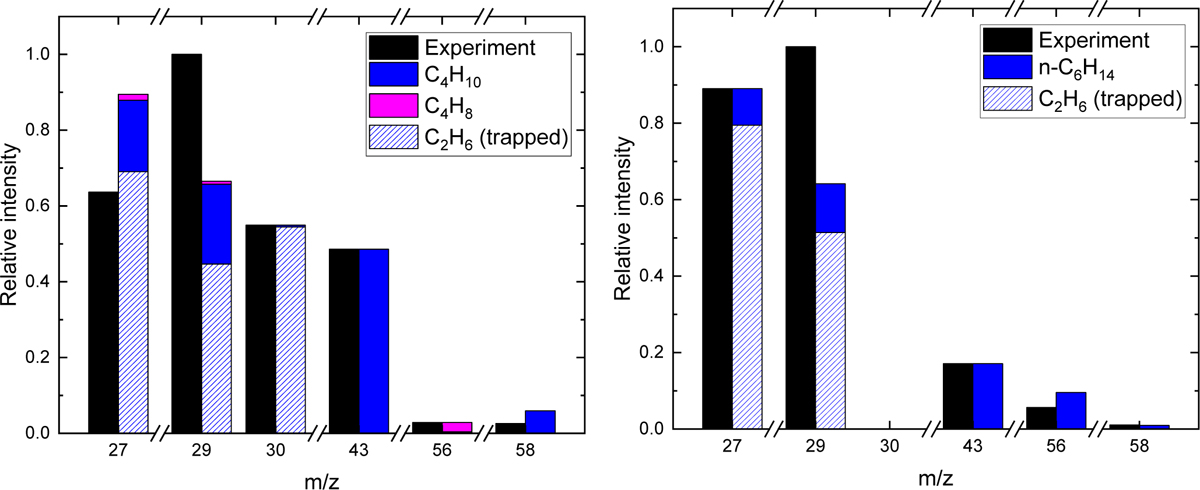
Left: Comparison between the observed intensities of m/z signals at 105 K for 70 eV electron ionization energy of the QMS and the mass fragmentation patterns of C4H10 (CH3CH2CH2CH3), C4H8 (CH2CHCH2CH3), and C2H6 (CH3CH3) acquired from NIST database. Right: Similar comparison between intensities obtained at 138 K with the mass fragmentation patterns of C6H14 (CH3CH2CH2CH2CH2CH3) and C2H6 (CH3 CH3) acquired from the NIST database. Experimental values are baseline subtracted. Only the selected m/z values with resolved peaks are presented.
Current usage metrics show cumulative count of Article Views (full-text article views including HTML views, PDF and ePub downloads, according to the available data) and Abstracts Views on Vision4Press platform.
Data correspond to usage on the plateform after 2015. The current usage metrics is available 48-96 hours after online publication and is updated daily on week days.
Initial download of the metrics may take a while.