Fig. 1
Download original image
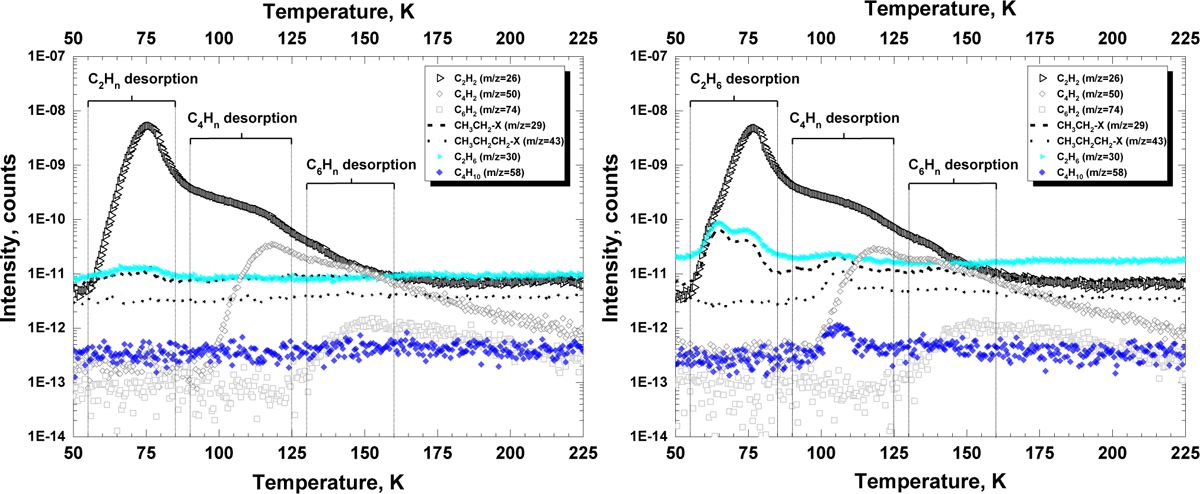
Left: QMS-TPD spectra in the range from 50 to 225 K for the selected m/z values obtained after the UV-exposure of 10 ML of pure HCCH ice with 4.6 × 10¹⁶ photons cm−2 at 10 K. Right: QMS-TPD spectrum obtained after the hydrogenation of UV-exposed ice with 1.3 × 1017 cm−2 atoms at 10 K. The ordinate axis is presented as a logarithm of 10. An exponential decay of ion intensity appears as a straight line.
Current usage metrics show cumulative count of Article Views (full-text article views including HTML views, PDF and ePub downloads, according to the available data) and Abstracts Views on Vision4Press platform.
Data correspond to usage on the plateform after 2015. The current usage metrics is available 48-96 hours after online publication and is updated daily on week days.
Initial download of the metrics may take a while.