Fig. 6.
Download original image
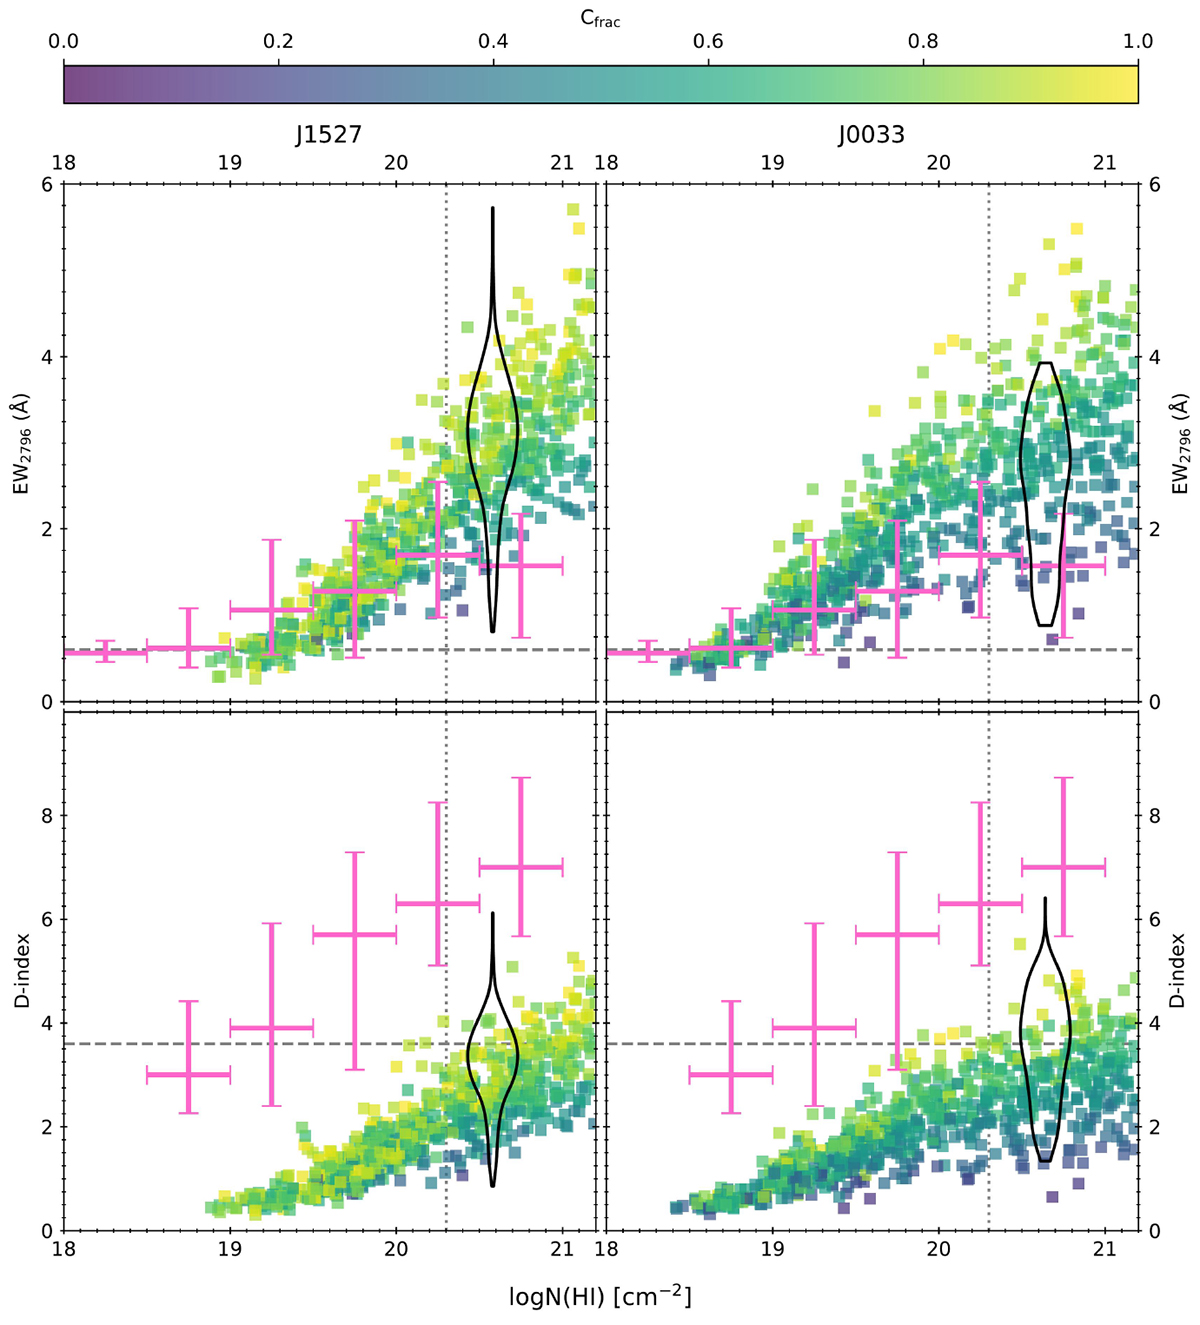
Model predictions of the DLA metrics EW2796 (top panels) and D-index (bottom panels) as a function of logN(H I) in the two fields J1527 (left column) and J0033 (right column). The vertical dotted line denotes the DLA threshold logN(H I) = 20.3 cm−2 whilst the horizontal dashed line denote the minimum thresholds for a system to be considered a DLA for that metric; points in the top-right corner of each panel would be considered a DLA. The hollow violins show the distribution of EW2796 and D-index for spaxels (with S/N ≥2 and EW2796 measured at > 2σ significance) within the field. The violins are arbitrarily centered at the median logN(H I) predicted by the modeling, whilst their widths are arbitrarily set for display purposes and do not represent the error in logN(H I). The pink errorbars show the median and 68th percentile confidence interval of the literature measurements of single quasar sightlines (taken from Rao et al. 2006; Ellison 2006; Berg et al. 2017). The literature values are binned in increments of 0.5 dex in logN(H I). We note that the D-index measurements from the literature are obtained at a different spectral resolutions than the MUSE observations, and thus satisfy a different D-index threshold to be considered a DLA. These literature points are only shown to denote the dependence of D-index on logN(H I) for individual quasar sightlines. The colored symbols represent the range of models within the 32nd and 68th percentiles of the posteriors of the four free parameters ![]() , and are color-coded by the covering fraction Cfrac. We stress that, while the literature data are obtained from point-source quasar sightlines, our model framework is designed to reproduce the gas absorption properties on extended sources.
, and are color-coded by the covering fraction Cfrac. We stress that, while the literature data are obtained from point-source quasar sightlines, our model framework is designed to reproduce the gas absorption properties on extended sources.
Current usage metrics show cumulative count of Article Views (full-text article views including HTML views, PDF and ePub downloads, according to the available data) and Abstracts Views on Vision4Press platform.
Data correspond to usage on the plateform after 2015. The current usage metrics is available 48-96 hours after online publication and is updated daily on week days.
Initial download of the metrics may take a while.