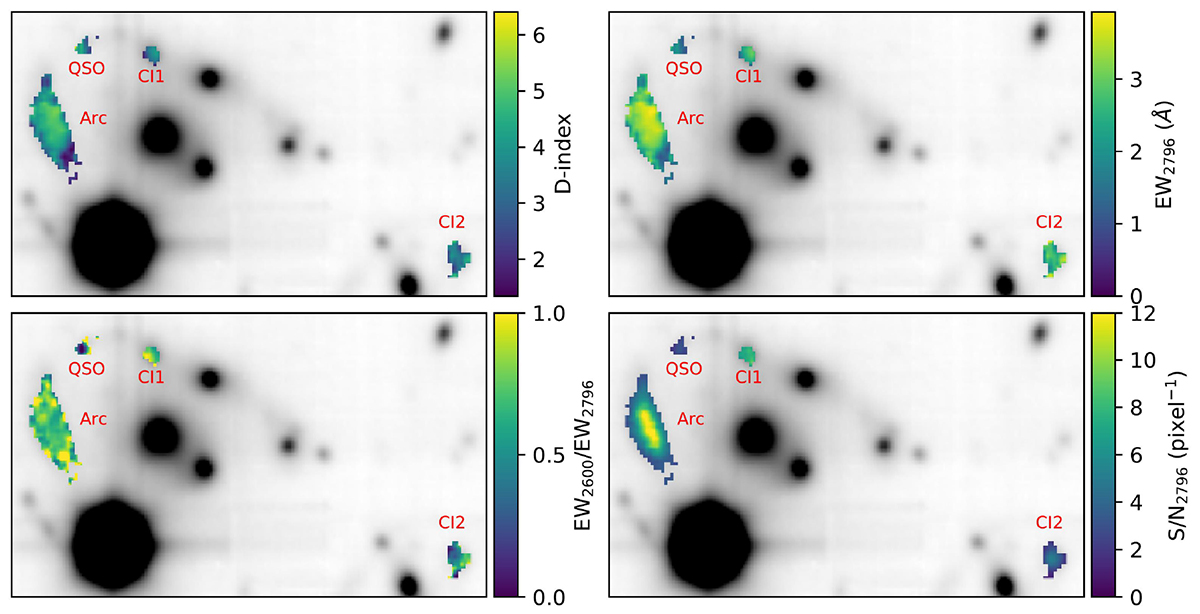
Fig. 2.
Download original image
Color maps of the lensed region in the J0033 field, showing the four different regions (Arc, QSO, CI1, and CI2) tracing Mg II absorption. The top left (D-index), top right (Mg IIλ2796 rest-frame equivalent width), and bottom left (Fe IIλ2600/Mg IIλ2796 equivalent width ratio) panels show three different metrics used in the literature to identify if the detected Mg II absorption is a potential DLA. The color bars are designed such that spaxels that are green and yellow colors in these three panels would be considered as potential DLA absorption. The bottom right panel shows the S/N at the position of the Mg II 2796 Å absorption at each spaxel. In all four panels, the white-light image of the cube is shown for reference. Only spaxels with S/N ≥2.0 at the position of Mg II 2796 Å and EW2796 detected at ≥2σ significance are colored in all four panels.
Current usage metrics show cumulative count of Article Views (full-text article views including HTML views, PDF and ePub downloads, according to the available data) and Abstracts Views on Vision4Press platform.
Data correspond to usage on the plateform after 2015. The current usage metrics is available 48-96 hours after online publication and is updated daily on week days.
Initial download of the metrics may take a while.