Open Access
Fig. 12
Download original image
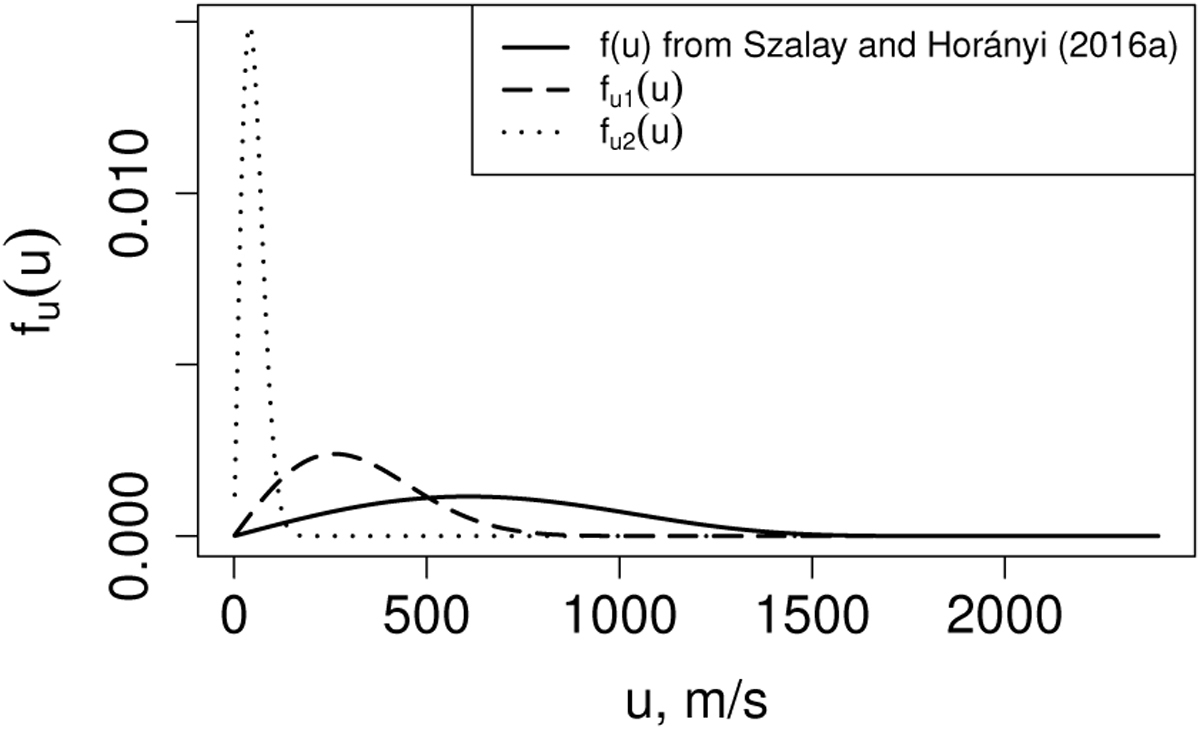
Test distributions of ejection velocity compared to the distribution obtained by Szalay & Horányi (2016a) and employed by Szalay & Horányi (2016b) and Szalay et al. (2019). The distribution fu1(u) corresponds to setting l = 40 m in Eq. (20). The curve fu2(u) is obtained by setting l = 1 m.
Current usage metrics show cumulative count of Article Views (full-text article views including HTML views, PDF and ePub downloads, according to the available data) and Abstracts Views on Vision4Press platform.
Data correspond to usage on the plateform after 2015. The current usage metrics is available 48-96 hours after online publication and is updated daily on week days.
Initial download of the metrics may take a while.