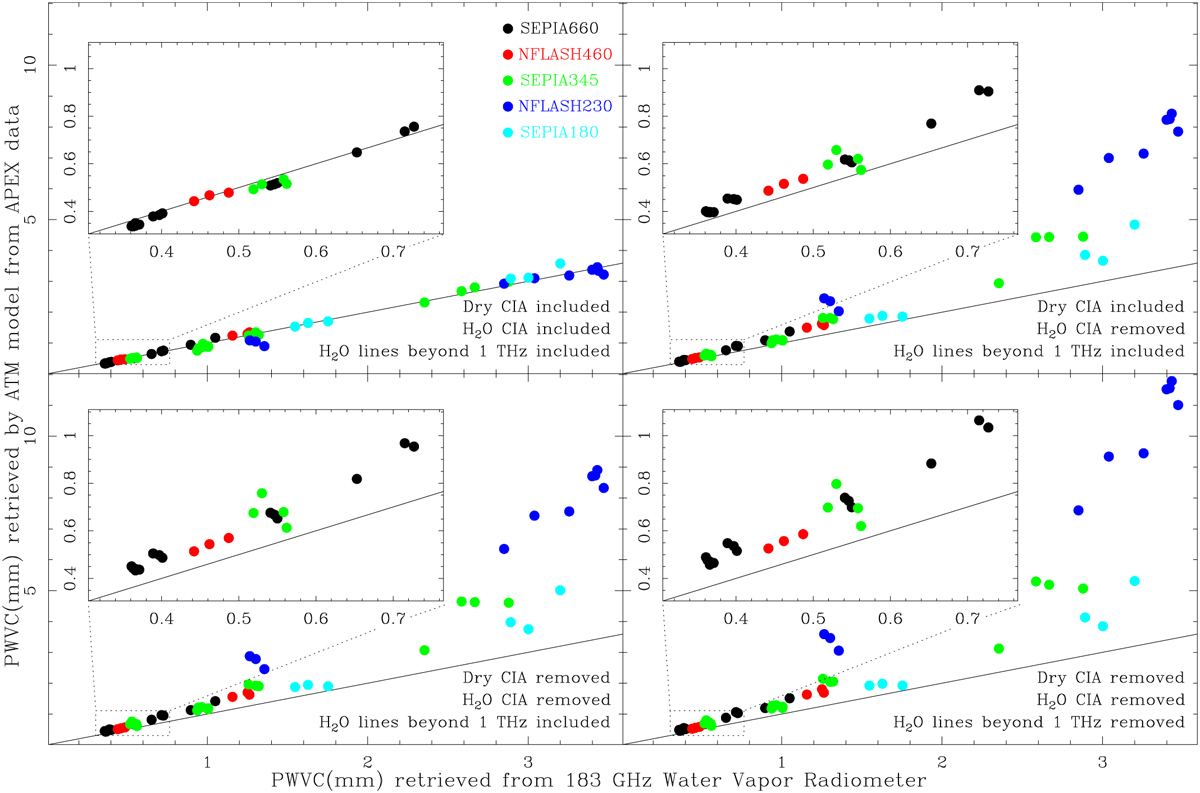
Fig. 5
Download original image
PWVC provided by the WVR (average over the scan) vs the one derived from ATM fits of APEX spectra under various scenarios. The inset in each panel corresponds to a zoom-in of the area marked by the dotted box. The solid black line in each panel, and in the insets, marks the bisector or diagonal or equal PWVC values derived from the two methods.
Current usage metrics show cumulative count of Article Views (full-text article views including HTML views, PDF and ePub downloads, according to the available data) and Abstracts Views on Vision4Press platform.
Data correspond to usage on the plateform after 2015. The current usage metrics is available 48-96 hours after online publication and is updated daily on week days.
Initial download of the metrics may take a while.