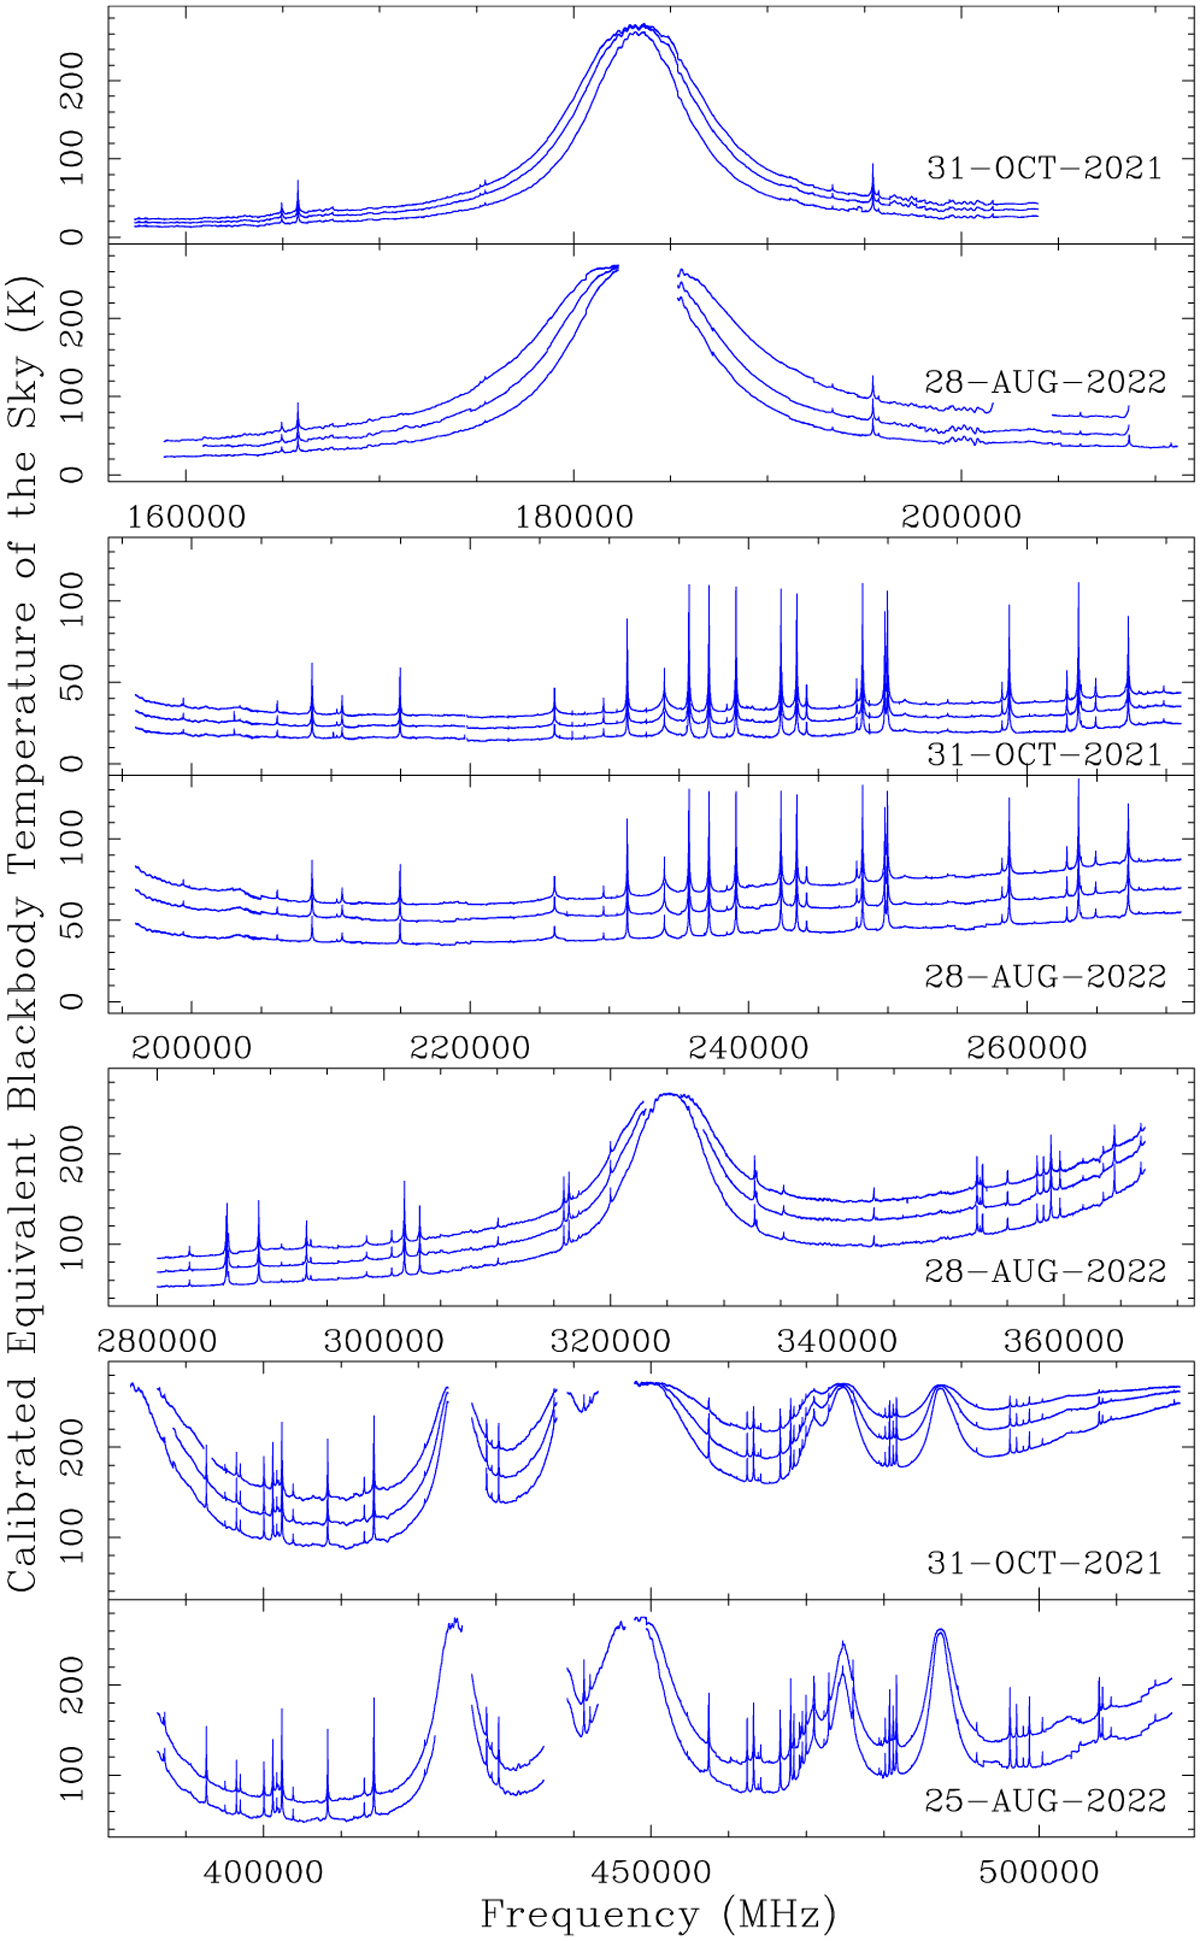
Fig. 2
Download original image
Subset of the 56 fully calibrated and cleaned atmospheric scans used in this study to validate CIA absorption terms in the ATM radiative transfer model. The several curves in each panel correspond to observations at different air mass values for each date listed in Table 1. The air mass increases from lower to upper equivalent blackbody temperature curves.
Current usage metrics show cumulative count of Article Views (full-text article views including HTML views, PDF and ePub downloads, according to the available data) and Abstracts Views on Vision4Press platform.
Data correspond to usage on the plateform after 2015. The current usage metrics is available 48-96 hours after online publication and is updated daily on week days.
Initial download of the metrics may take a while.