Fig. 1
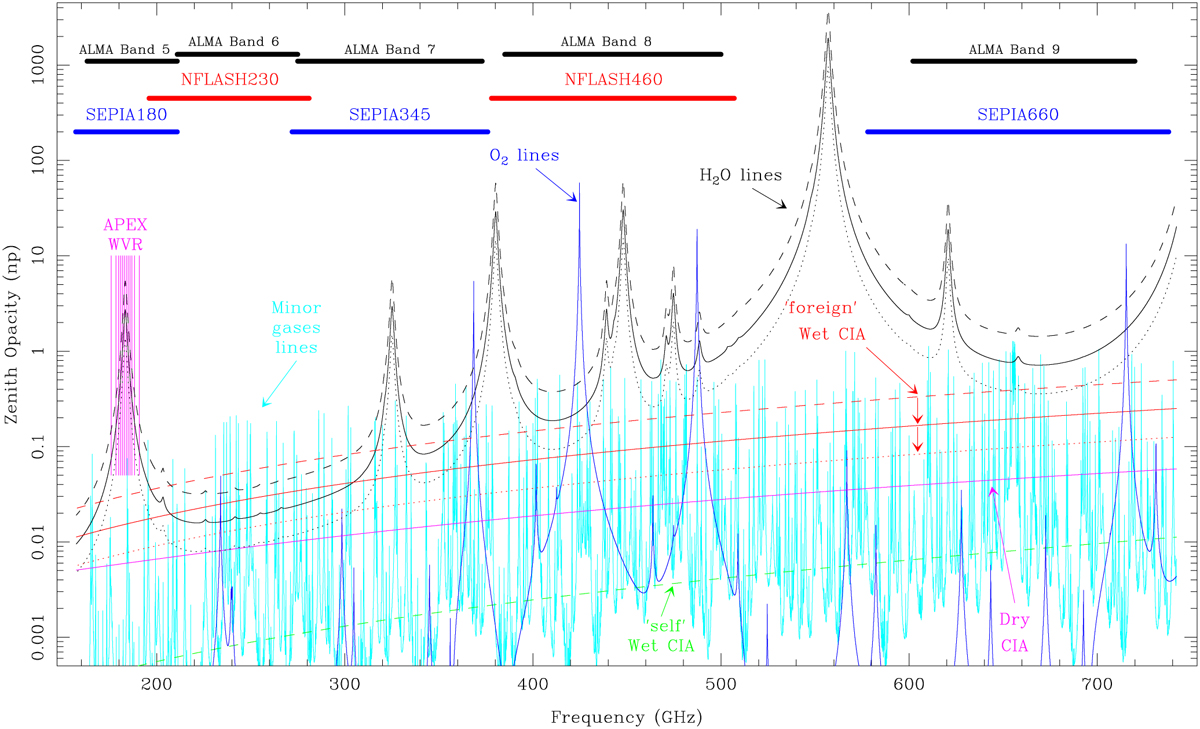
Download original image
Reference ATM model for the APEX site, considering 555 hPa and 273 K as physical parameters at the ground, and 0.5 (dotted black and red lines), 1.0 (solid black and red lines), and 2.0 mm (dashed black and red lines) of the PWVC. Note that the H2O–H2O (self wet) CIA is in practice negligible in these very dry conditions (only the curve for 2.0 mm PWVC is shown in a dashed green colour as the curves for 1.0 and 0.5 mm PWVC are below the bottom Y limit of the plot). The frequency ranges covered by the SEPIA and nFLASH receivers used in this work are plotted for reference, as are ALMA bands 5–9. The central frequencies of the six double side-band channels of the APEX WVR, on both sides of the 183.31 GHz H2O line, are also plotted. The red and pink ClA curves are the ones under validation in this paper. Cyan (minor gases opacity), blue (O2 lines opacity) and pink (dry CIA opacity) curves remain unchanged for all PWVC values.
Current usage metrics show cumulative count of Article Views (full-text article views including HTML views, PDF and ePub downloads, according to the available data) and Abstracts Views on Vision4Press platform.
Data correspond to usage on the plateform after 2015. The current usage metrics is available 48-96 hours after online publication and is updated daily on week days.
Initial download of the metrics may take a while.