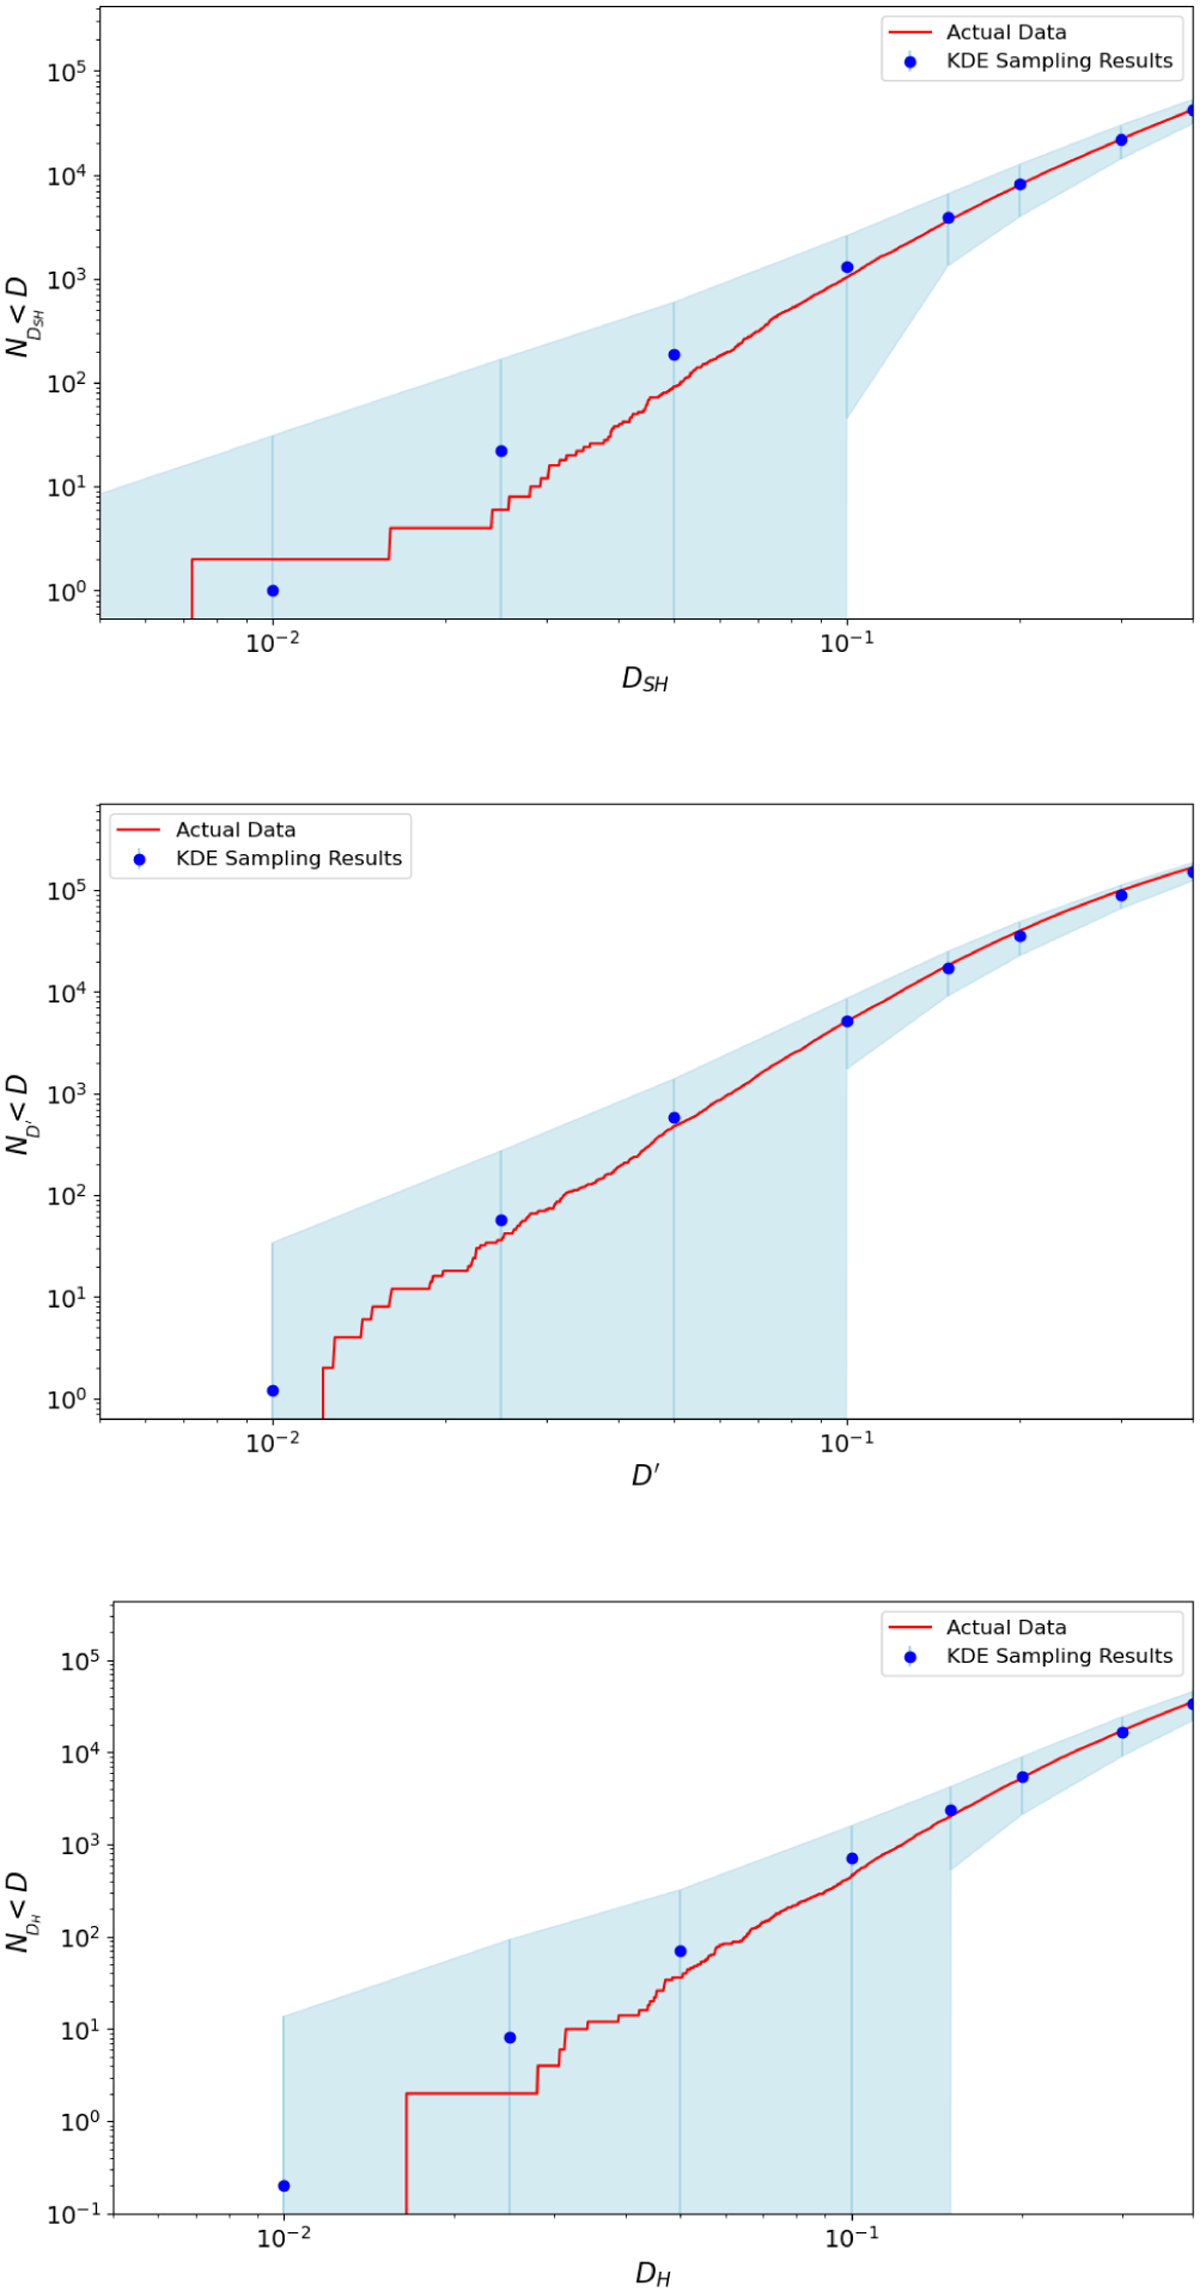
Fig. 9
Download original image
Number of unique pairs, ND, within the 616 possible 1 g final mass fireballs observed by the GFO-FRIPON-EFN with D values below a limiting threshold (red line) compared to the predicted number based on random associations (blue circles with error bars) for DS H, D′, and Dh. The blue circles represent the mean number of pairs identified between two 616 random samples drawn from the possible 1 g fall PDF (Fig. 4) from 500 iterations of KDE sampling. The blue-shaded indicates a zone encompassing three standard deviations. The number of low-D value pairs corresponds very well to the predicted number based on random associations, indicating no substantial evidence supporting streams in the fireball dataset.
Current usage metrics show cumulative count of Article Views (full-text article views including HTML views, PDF and ePub downloads, according to the available data) and Abstracts Views on Vision4Press platform.
Data correspond to usage on the plateform after 2015. The current usage metrics is available 48-96 hours after online publication and is updated daily on week days.
Initial download of the metrics may take a while.