Fig. 6
Download original image
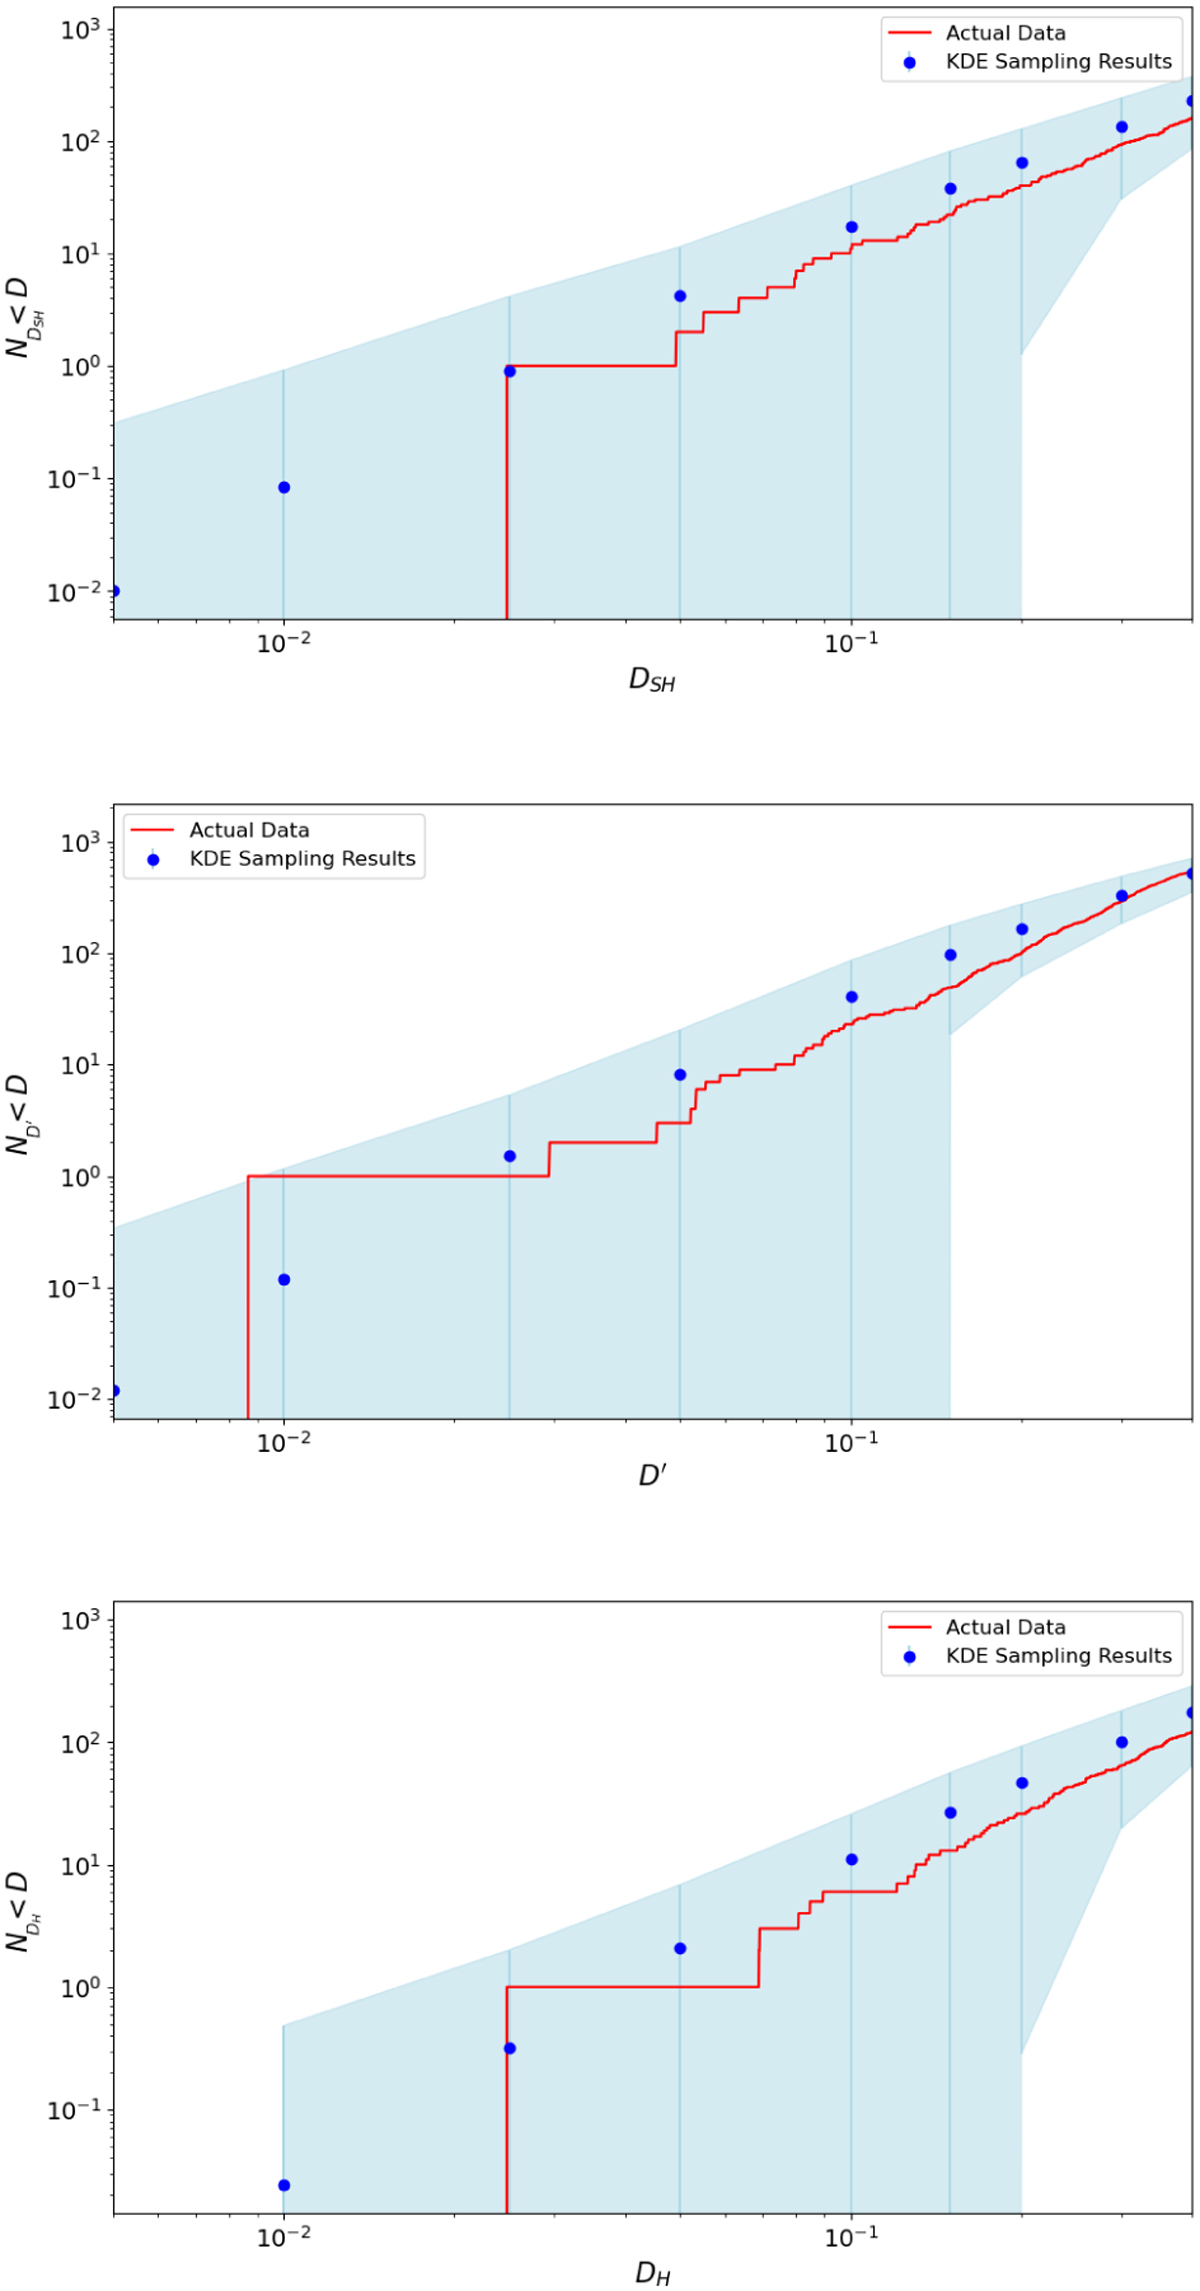
Number of meteorite-meteorite pairs, ND, with D values below a limiting threshold (red line) compared to the predicted number based on random associations (blue circles with error bars) for DS H, D′, and DH. The blue circles represent the mean number of pairs from 500 iterations of KDE sampling using a bandwidth of 0.1 based on 350 possible/likely 50 g meteorite falls observed by the GFO, FRIPON, and EFN networks. The blue-shaded area is the 3 σ range possible from random associations. The actual number of low-D value pairs is consistent with the predicted number based on random associations.
Current usage metrics show cumulative count of Article Views (full-text article views including HTML views, PDF and ePub downloads, according to the available data) and Abstracts Views on Vision4Press platform.
Data correspond to usage on the plateform after 2015. The current usage metrics is available 48-96 hours after online publication and is updated daily on week days.
Initial download of the metrics may take a while.