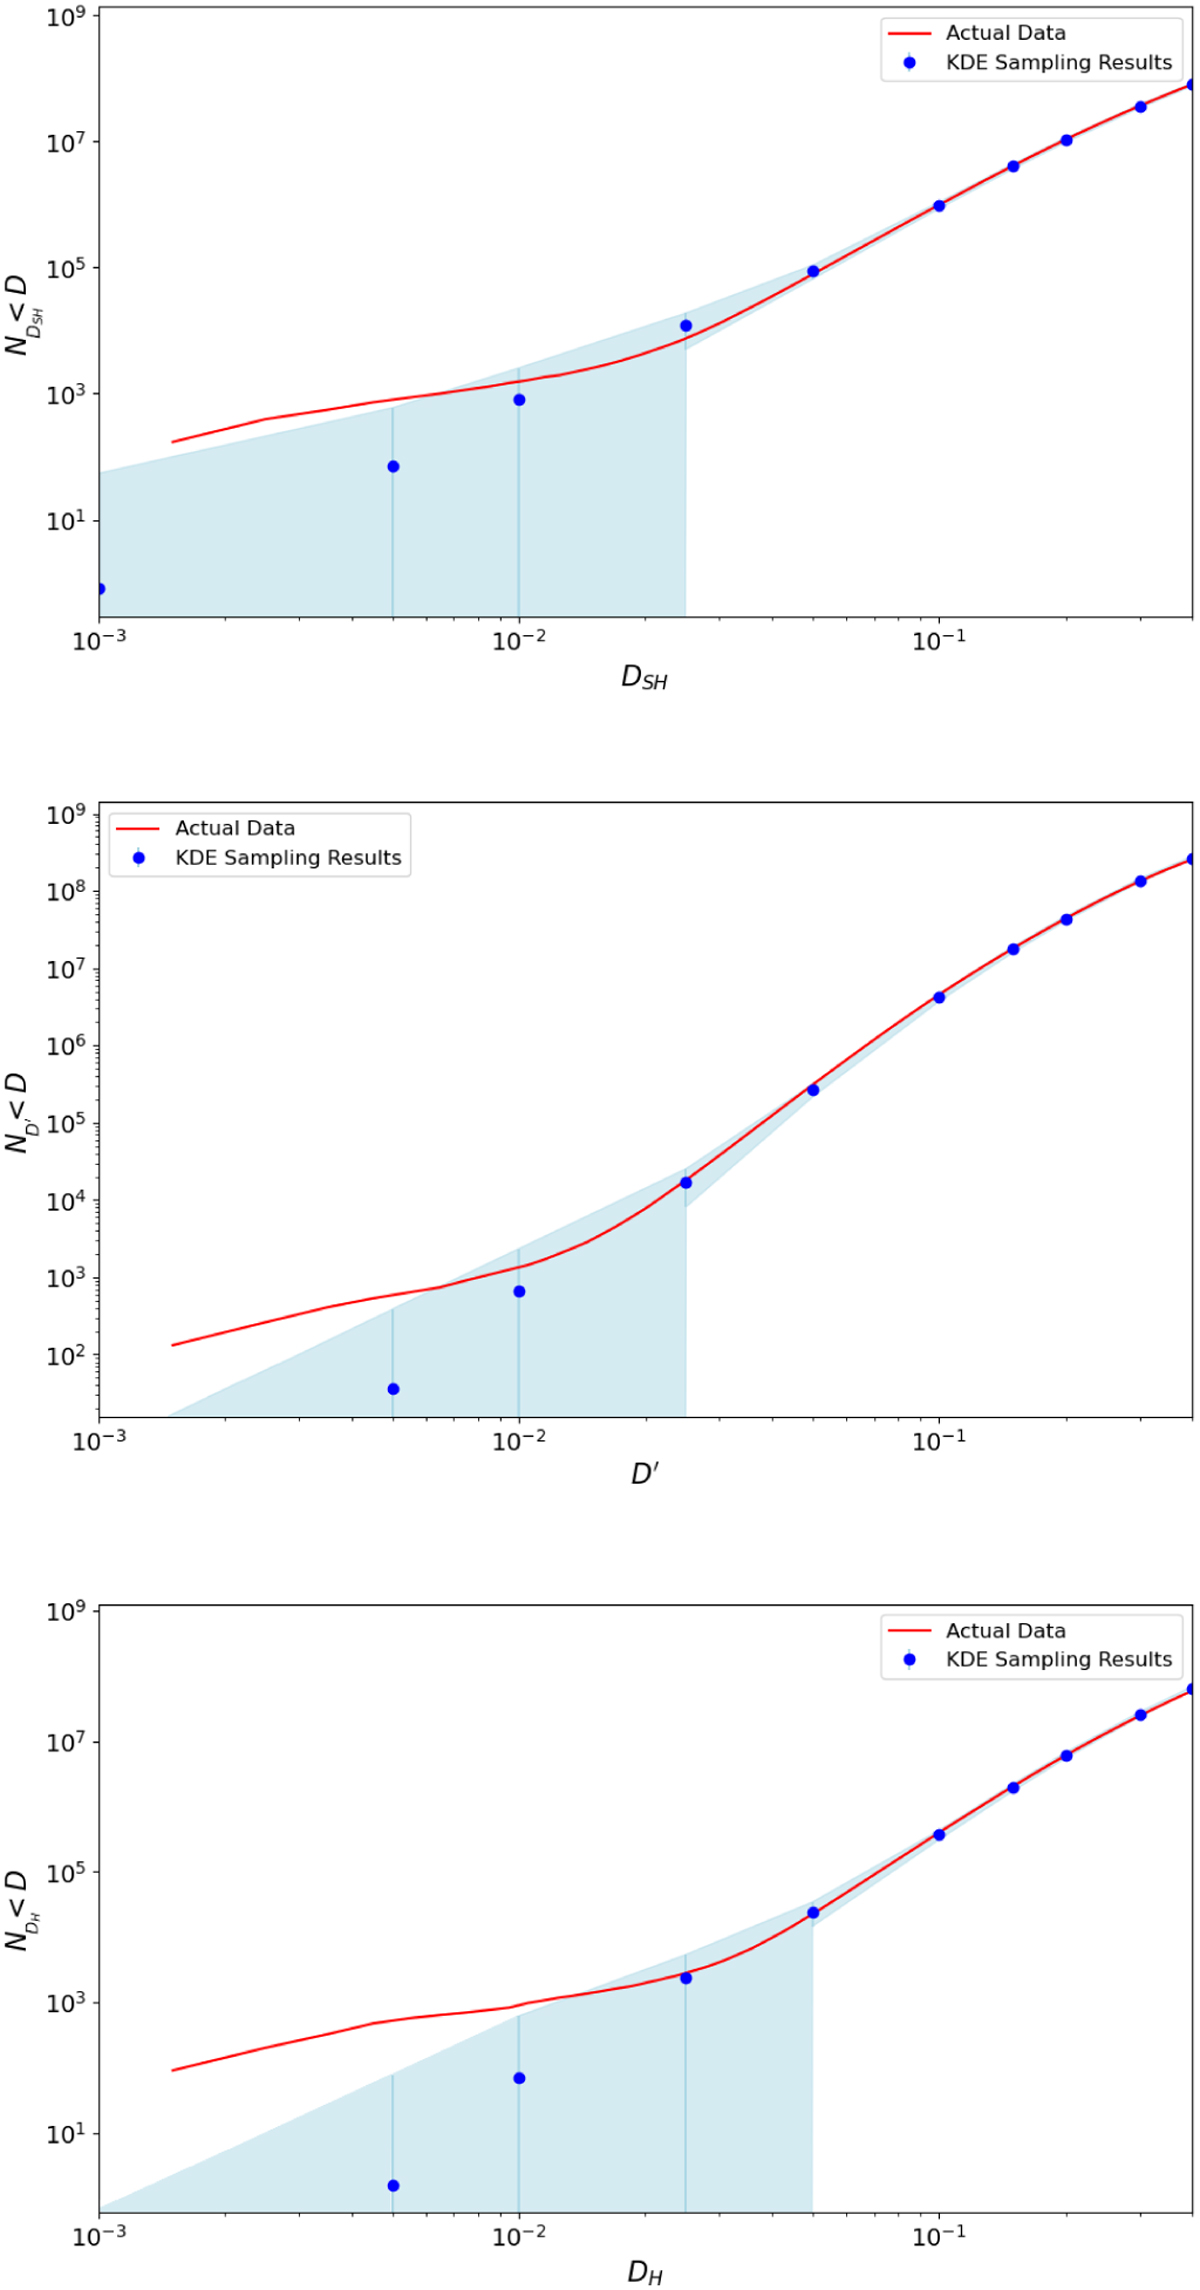
Fig. 11
Download original image
Number of NEO – NEO pairs with D values below a limiting threshold (red line) compared to the predicted number based on random associations (blue circles with error bars) for Dsh, D′, and Dh. The blue circles represent the mean number of pairs from 500 iterations of KDE sampling using a bandwidth of 0.15, with a shaded blue region indicating a zone encompassing three standard deviations. The number of low-D value pairs corresponds very well to the predicted number based on random associations for large values; however, at very low D values, there appear to be tens of objects with statistically significant similarities. The observational biases of the dataset do not predict the elbow in the cumulative D-value plots.
Current usage metrics show cumulative count of Article Views (full-text article views including HTML views, PDF and ePub downloads, according to the available data) and Abstracts Views on Vision4Press platform.
Data correspond to usage on the plateform after 2015. The current usage metrics is available 48-96 hours after online publication and is updated daily on week days.
Initial download of the metrics may take a while.