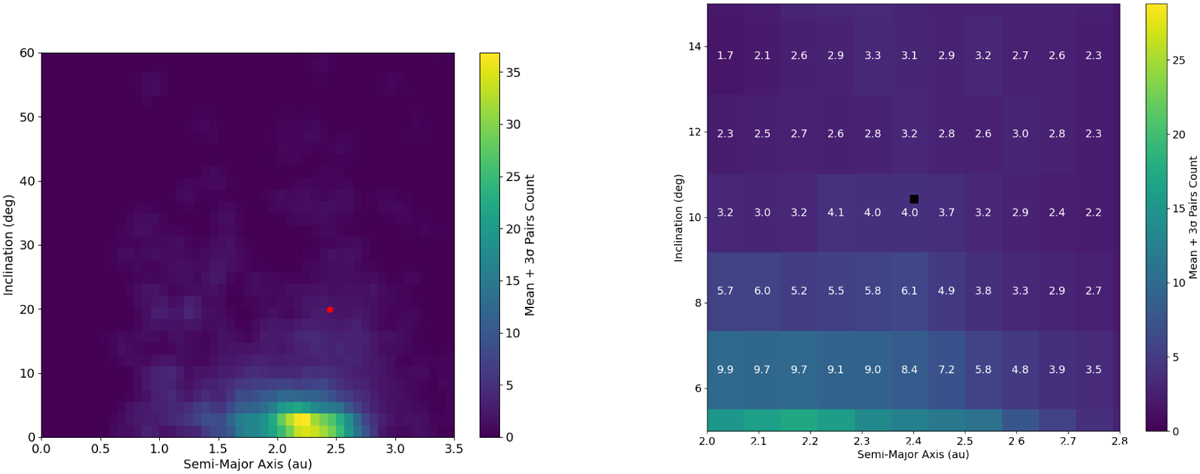
Fig. 10
Download original image
Maximum false positive heat map for bins of semi-major axis (au) by inclination (deg). The heat map coloration represents the mean number of pairs plus 3σ that have DH < 0.1. The sporadic orbital distribution was estimated using the 616 possible 1 g fall observations PDF (Fig. 4). The means and standard deviations were calculated through 500 iterations of KDE sampling. Subplot a examines the maximum number of expected random associations within a population of 616 fireballs, only one (red) in the observations has a measured DH < 0.1, but it is not statistically significant. Subplot b re-examines the significance of the Príbram-Neuschwanstein pair (black square); however, the pair is still not statistically significant within a fireball population of 481 orbits.
Current usage metrics show cumulative count of Article Views (full-text article views including HTML views, PDF and ePub downloads, according to the available data) and Abstracts Views on Vision4Press platform.
Data correspond to usage on the plateform after 2015. The current usage metrics is available 48-96 hours after online publication and is updated daily on week days.
Initial download of the metrics may take a while.