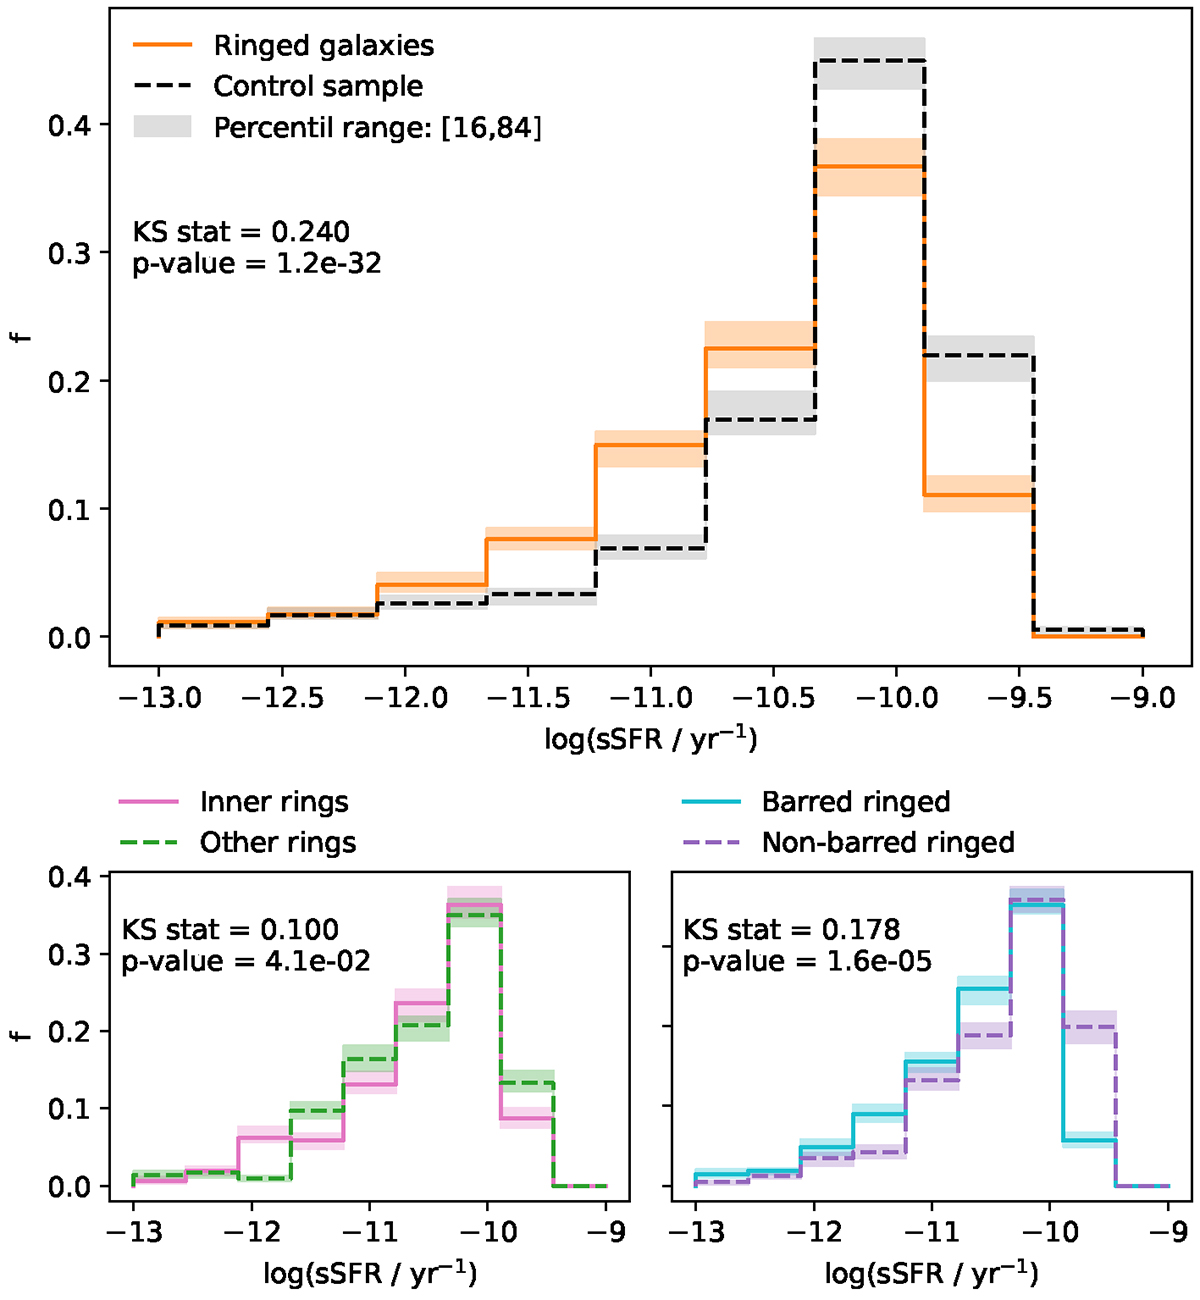
Fig. 3.
Download original image
Distribution of the global log(sSFR) for the analyzed z in the TNG50 simulation. The upper panel shows the fraction of ringed galaxies compared to the control sample. The lower panels provide a more detailed breakdown, showing the same relationship for inner ringed galaxies versus other types of rings (left panel) and barred versus non-barred ringed galaxies (right panel) across the available z in TNG50.
Current usage metrics show cumulative count of Article Views (full-text article views including HTML views, PDF and ePub downloads, according to the available data) and Abstracts Views on Vision4Press platform.
Data correspond to usage on the plateform after 2015. The current usage metrics is available 48-96 hours after online publication and is updated daily on week days.
Initial download of the metrics may take a while.