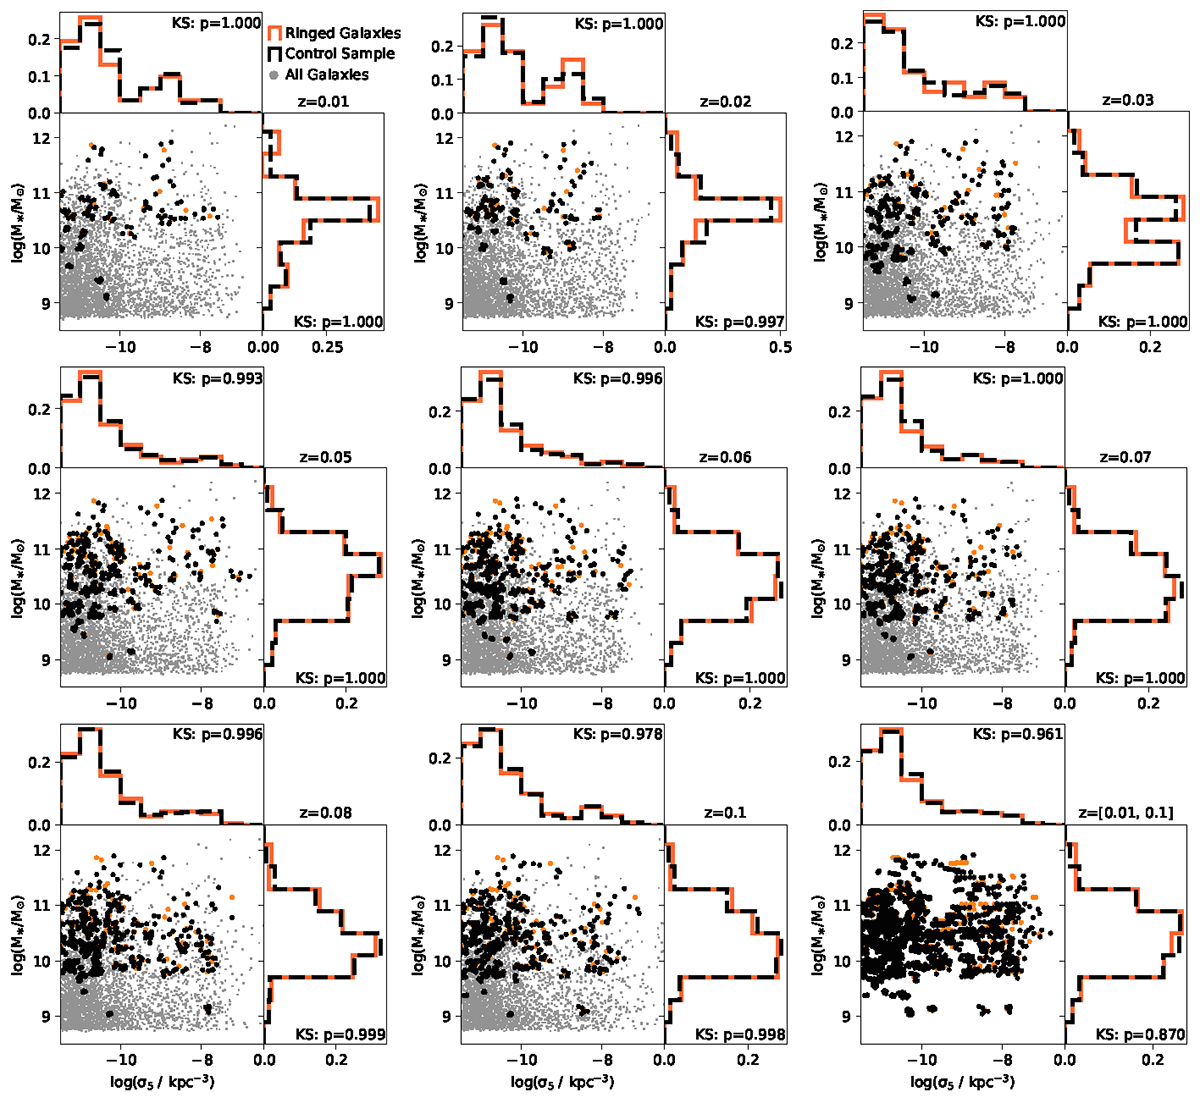
Fig. 2.
Download original image
Arrangement of galaxies with M⋆ > 109 M⊙ in the parameter space σ5 − M⋆ (small gray dots). For each ringed galaxy (orange dot), its control group of non-ringed galaxies is shown (black dots, five nearest neighbors of equal z). The histograms show the distributions of each variable at each redshift for the ringed galaxies and their respective control samples. The p-values, obtained through a Kolmogorov-Smirnov (KS) test, representative of the goodness of fit of the distributions of both samples for each quantity, are displayed in their respective panels.
Current usage metrics show cumulative count of Article Views (full-text article views including HTML views, PDF and ePub downloads, according to the available data) and Abstracts Views on Vision4Press platform.
Data correspond to usage on the plateform after 2015. The current usage metrics is available 48-96 hours after online publication and is updated daily on week days.
Initial download of the metrics may take a while.