Fig. 11.
Download original image
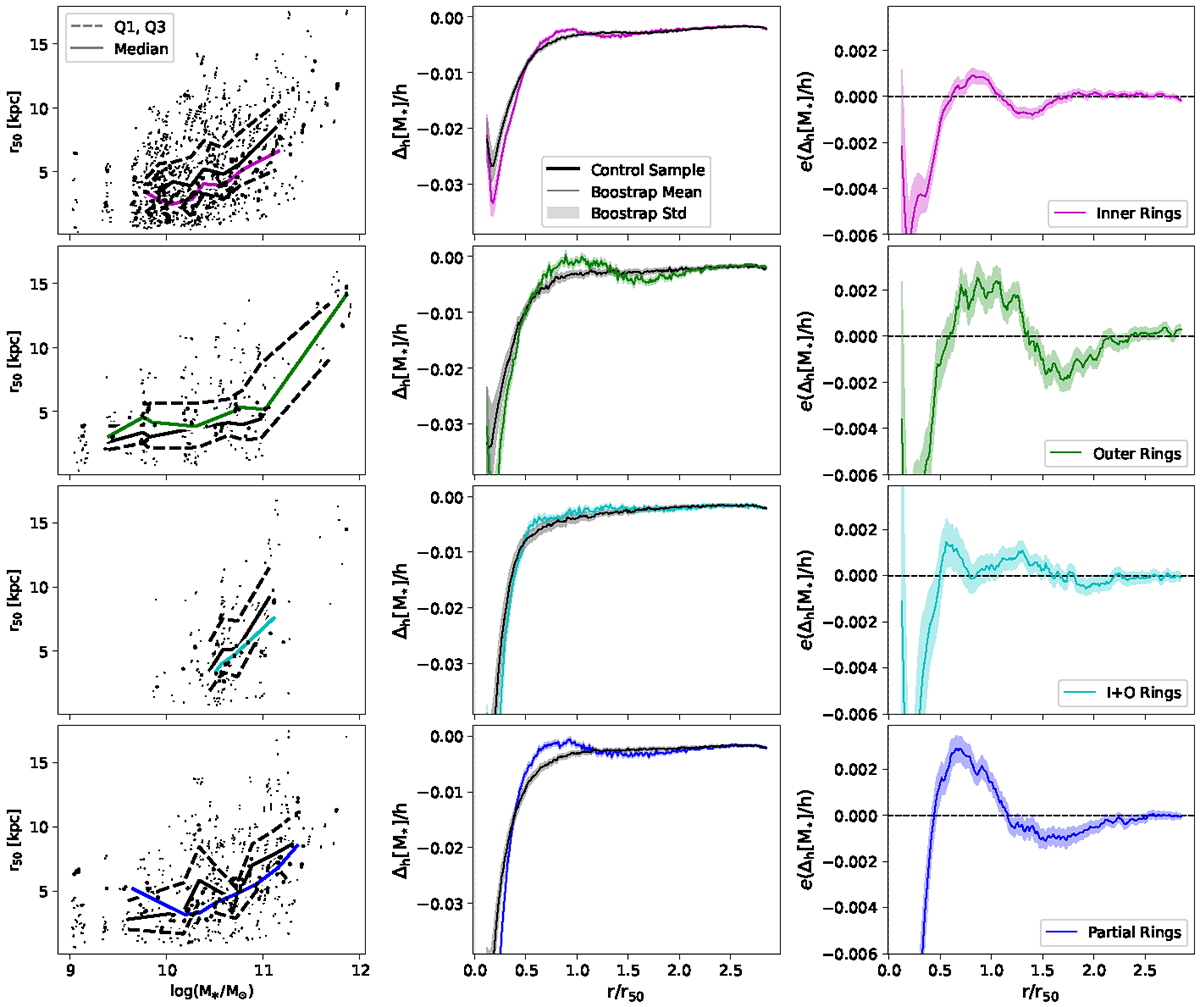
Structural description of the rings. Left column: mass-size relation for the different types of ringed galaxies (inner, outer, i+o, and partial rings) with their respective control samples; The solid lines show the median trends for each sample, constructed from a stellar masses binning, while dashed lines enclosed the inter-quartile range of each control distribution. Middle and right columns: Bootstrap mean and standard deviation of the stack, as a function of r50, of the slopes of the radial mass profile and residuals obtained by approximating the slope profile of a ringed galaxy by the median of those of its control group.
Current usage metrics show cumulative count of Article Views (full-text article views including HTML views, PDF and ePub downloads, according to the available data) and Abstracts Views on Vision4Press platform.
Data correspond to usage on the plateform after 2015. The current usage metrics is available 48-96 hours after online publication and is updated daily on week days.
Initial download of the metrics may take a while.