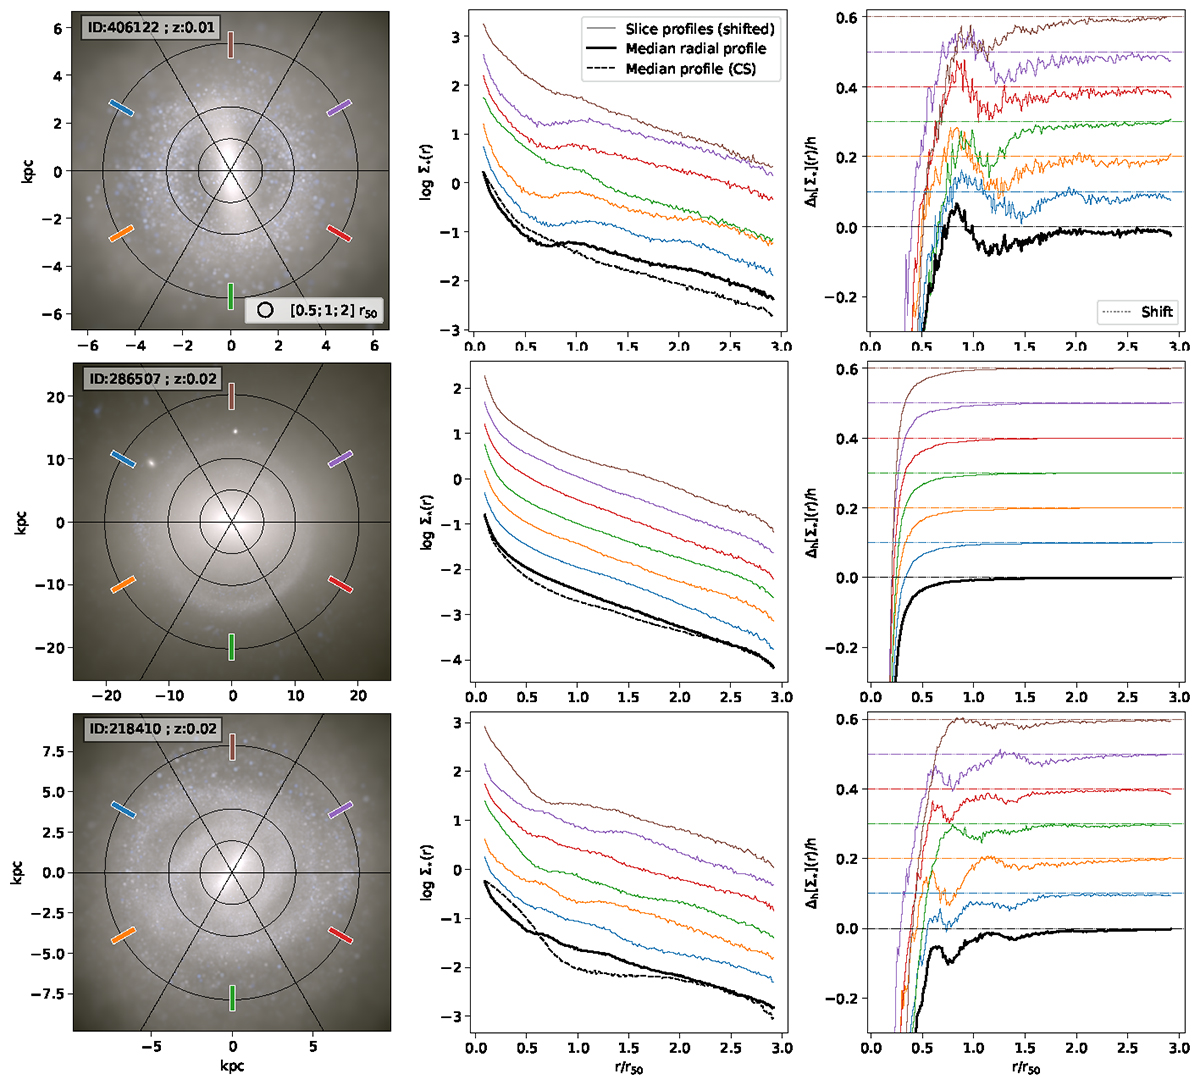
Fig. 10.
Download original image
Examples of radial surface mass density profiles of ringed galaxies. The first column shows the face-on projection of a galaxy with an inner ring (top row), an outer ring (middle row), and i+o rings (bottom row). The polar mesh that defines the azimuthal sections where the radial profiles are calculated is also displayed. These profiles are presented in the middle column, identified with the color that denotes their sections in the grid, and are shifted along the y-axis. The global profiles of the ringed galaxy and its control group are represented by solid and dashed black lines. The right column displays the derivatives of the profiles, approximated by forward finite differences.
Current usage metrics show cumulative count of Article Views (full-text article views including HTML views, PDF and ePub downloads, according to the available data) and Abstracts Views on Vision4Press platform.
Data correspond to usage on the plateform after 2015. The current usage metrics is available 48-96 hours after online publication and is updated daily on week days.
Initial download of the metrics may take a while.