Fig. 3.
Download original image
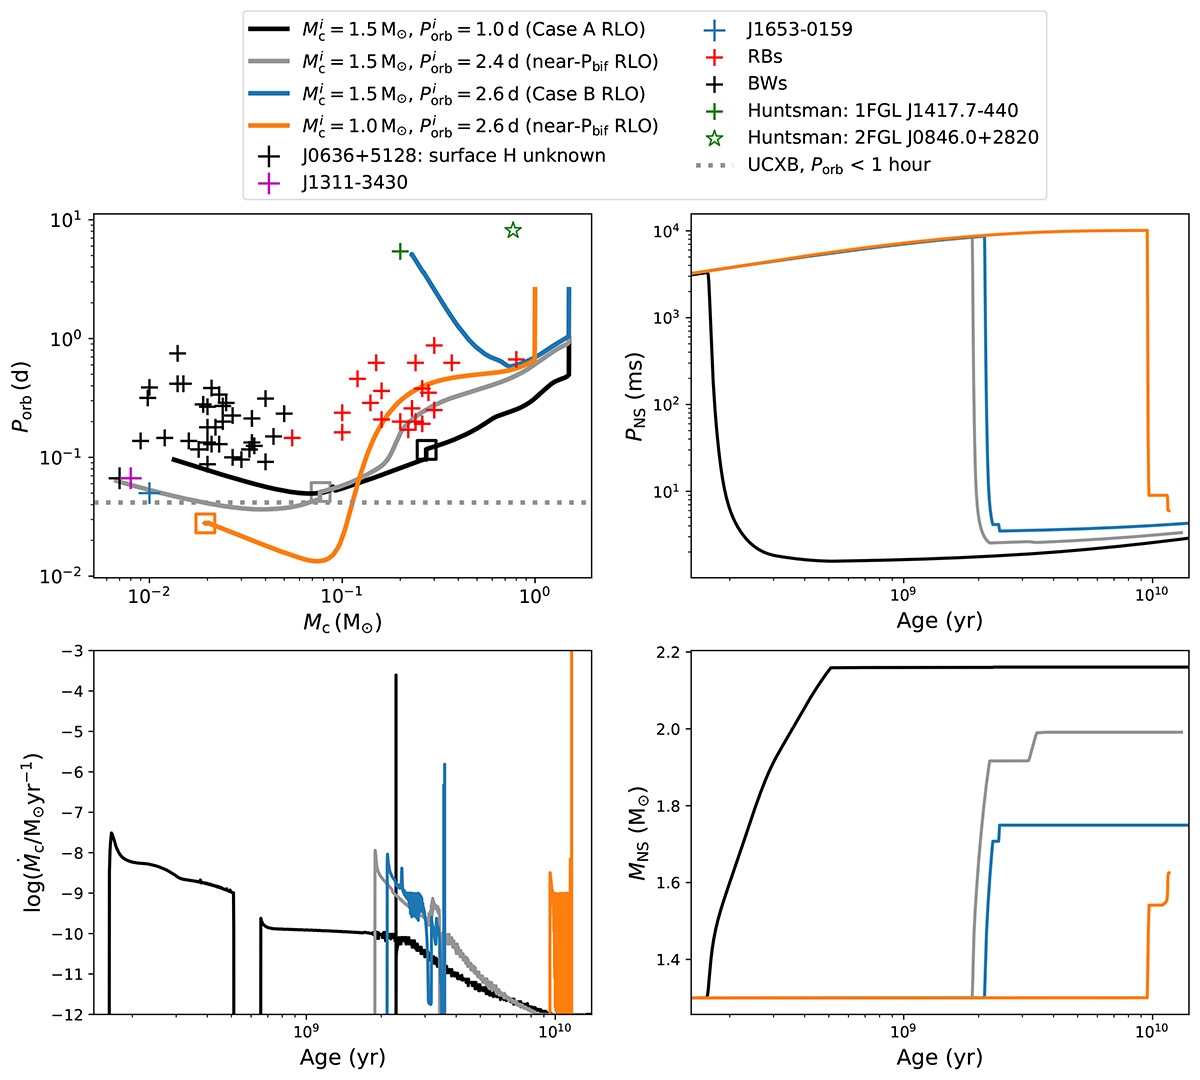
Evolution of selected binaries from our simulated grids for β = 0.3, fpular = 0.0, and ![]() . The three different kinds of binaries that we discuss in the text are studied here: case A (
. The three different kinds of binaries that we discuss in the text are studied here: case A (![]() d), near-Pbif (
d), near-Pbif (![]() d), and case B or diverging (
d), and case B or diverging (![]() d). Also shown is the binary that goes down to the orbital period of 19 min (orange curve) for comparison, which is the minimum in the grid with fpulsar = 0.0. Top left shows the orbital period versus companion mass, where Mc is the mass of the companion to the NS and Porb is the orbital period. The formation of a fully convective star and the start of the ejection phase are shown as squares. We also compare our tracks to estimated Mc, min and observed Porb for BWs (faint black crosses), RBs (faint red crosses), and huntsmen spiders (faint green crosses), from Nedreaas (2024, and references therein). The green star is the huntsman candidate 2FGL J0846.0+2820, observed by Fermi-LAT (Swihart et al. 2017). The tidarrens, namely, J1311–3430, J1653–0159, and J0636+5128, are highlighted as pink, blue, and black crosses, respectively. Top right, bottom left, and bottom right show the time evolution of the NS spin, companion mass loss rate, and NS mass, respectively, for the same binaries. The time axis is zoomed in to focus on the spin-up phase.
d). Also shown is the binary that goes down to the orbital period of 19 min (orange curve) for comparison, which is the minimum in the grid with fpulsar = 0.0. Top left shows the orbital period versus companion mass, where Mc is the mass of the companion to the NS and Porb is the orbital period. The formation of a fully convective star and the start of the ejection phase are shown as squares. We also compare our tracks to estimated Mc, min and observed Porb for BWs (faint black crosses), RBs (faint red crosses), and huntsmen spiders (faint green crosses), from Nedreaas (2024, and references therein). The green star is the huntsman candidate 2FGL J0846.0+2820, observed by Fermi-LAT (Swihart et al. 2017). The tidarrens, namely, J1311–3430, J1653–0159, and J0636+5128, are highlighted as pink, blue, and black crosses, respectively. Top right, bottom left, and bottom right show the time evolution of the NS spin, companion mass loss rate, and NS mass, respectively, for the same binaries. The time axis is zoomed in to focus on the spin-up phase.
Current usage metrics show cumulative count of Article Views (full-text article views including HTML views, PDF and ePub downloads, according to the available data) and Abstracts Views on Vision4Press platform.
Data correspond to usage on the plateform after 2015. The current usage metrics is available 48-96 hours after online publication and is updated daily on week days.
Initial download of the metrics may take a while.