Fig. 11.
Download original image
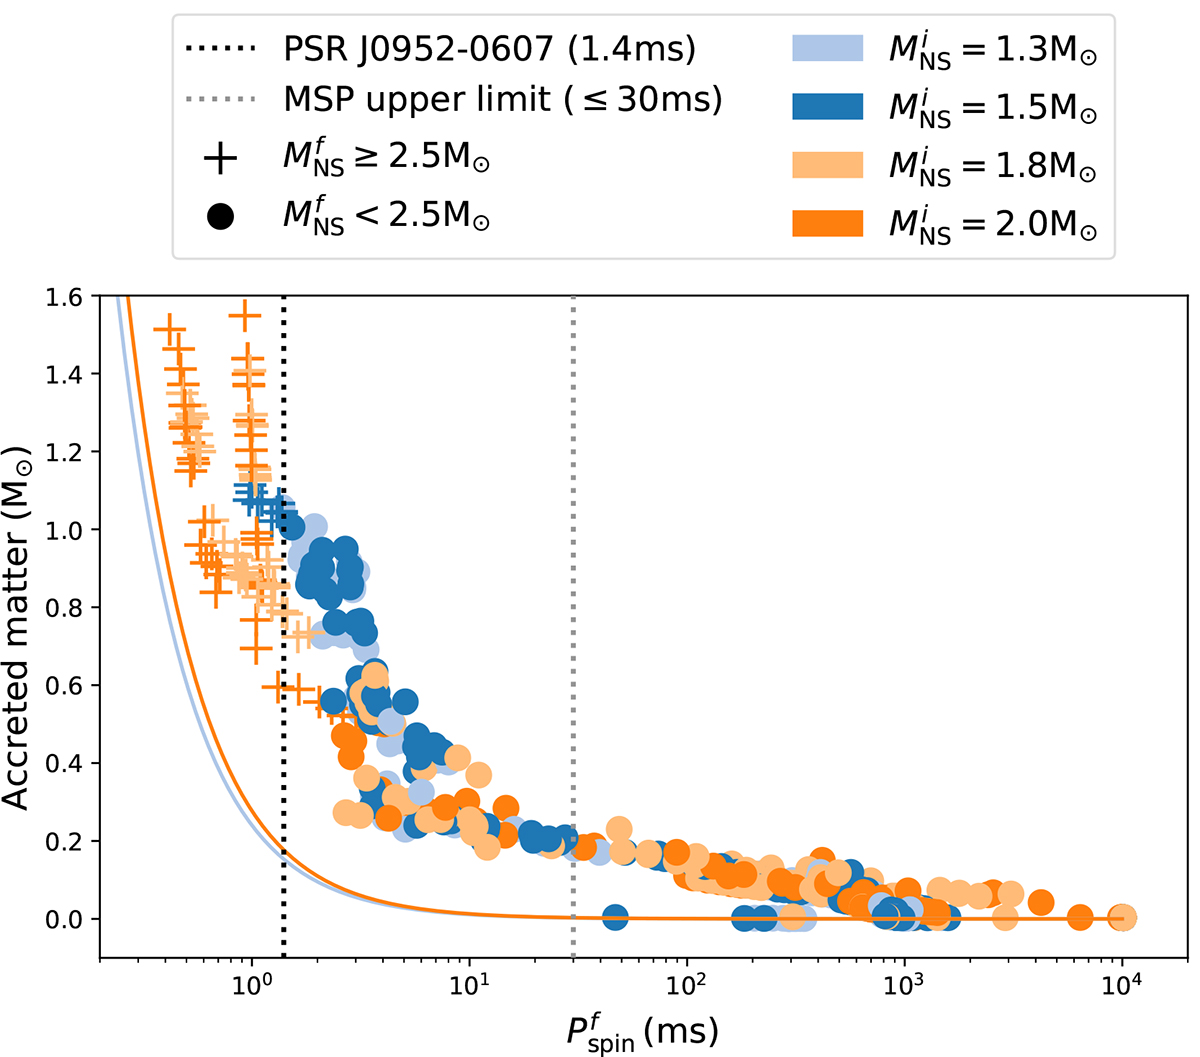
Accreted mass versus final NS spins (![]() ) in our simulated grid with β = 0.3. We show the different initial masses as different colors (shown in the legend) and distinguish between the NSs that had
) in our simulated grid with β = 0.3. We show the different initial masses as different colors (shown in the legend) and distinguish between the NSs that had ![]() (crosses) and those where
(crosses) and those where ![]() (circles). We also compare our results to the equilibrium spin period calculations from Tauris et al. (2012), done for
(circles). We also compare our results to the equilibrium spin period calculations from Tauris et al. (2012), done for ![]() (light blue curve) and 2.0 M⊙ (dark orange curve). The black dotted line shows the observed spin for PSR J0952–0607 (spin period of 1.41 ms) and the gray dotted line shows the upper limit for MSPs considered (30 ms).
(light blue curve) and 2.0 M⊙ (dark orange curve). The black dotted line shows the observed spin for PSR J0952–0607 (spin period of 1.41 ms) and the gray dotted line shows the upper limit for MSPs considered (30 ms).
Current usage metrics show cumulative count of Article Views (full-text article views including HTML views, PDF and ePub downloads, according to the available data) and Abstracts Views on Vision4Press platform.
Data correspond to usage on the plateform after 2015. The current usage metrics is available 48-96 hours after online publication and is updated daily on week days.
Initial download of the metrics may take a while.