Fig. 7.
Download original image
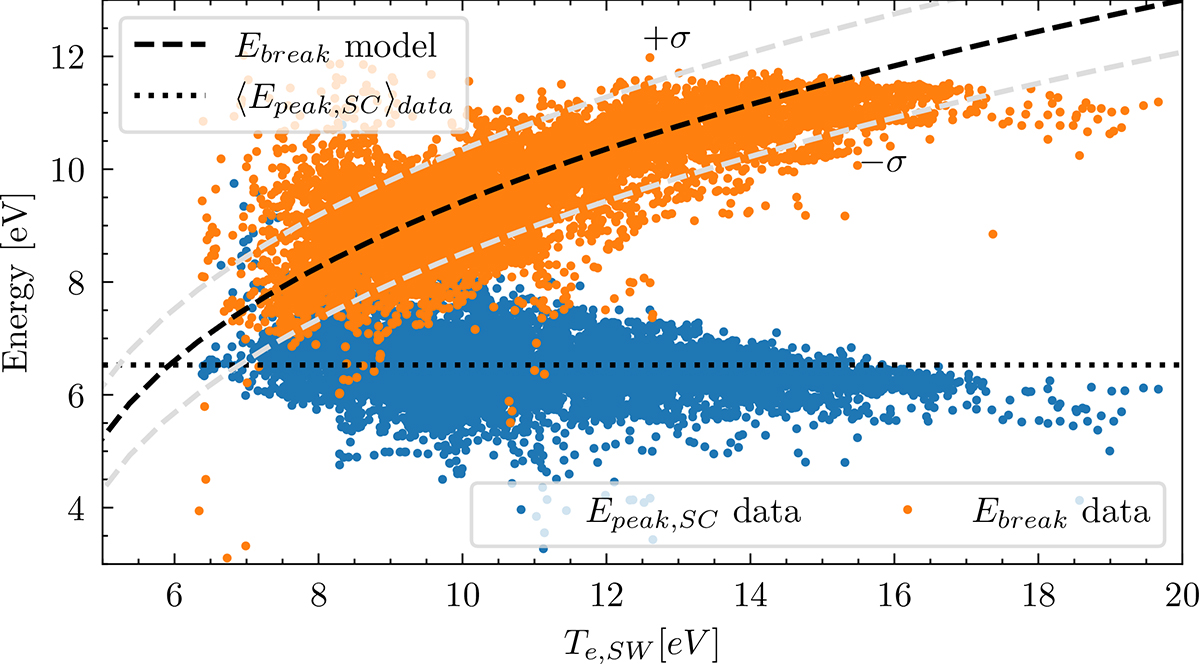
Peak energy for the differential energy flux of spacecraft electrons, Epeak, SC, (blue dots) and energy for the spectrum break between spacecraft and ambient plasma electrons, Ebreak, (orange dots) is plotted as a function of the electron core temperature Te, core. The black dotted line indicates the mean value of Epeak, SC. The black dashed line shows the model dependency of Ebreak for the case of two Maxwellian populations for mean parameters derived from the dataset, the grey dashed lines show the model shifted by the standard deviation, σmodel, of the difference between the model and Ebreak from the dataset.
Current usage metrics show cumulative count of Article Views (full-text article views including HTML views, PDF and ePub downloads, according to the available data) and Abstracts Views on Vision4Press platform.
Data correspond to usage on the plateform after 2015. The current usage metrics is available 48-96 hours after online publication and is updated daily on week days.
Initial download of the metrics may take a while.