Fig. 4.
Download original image
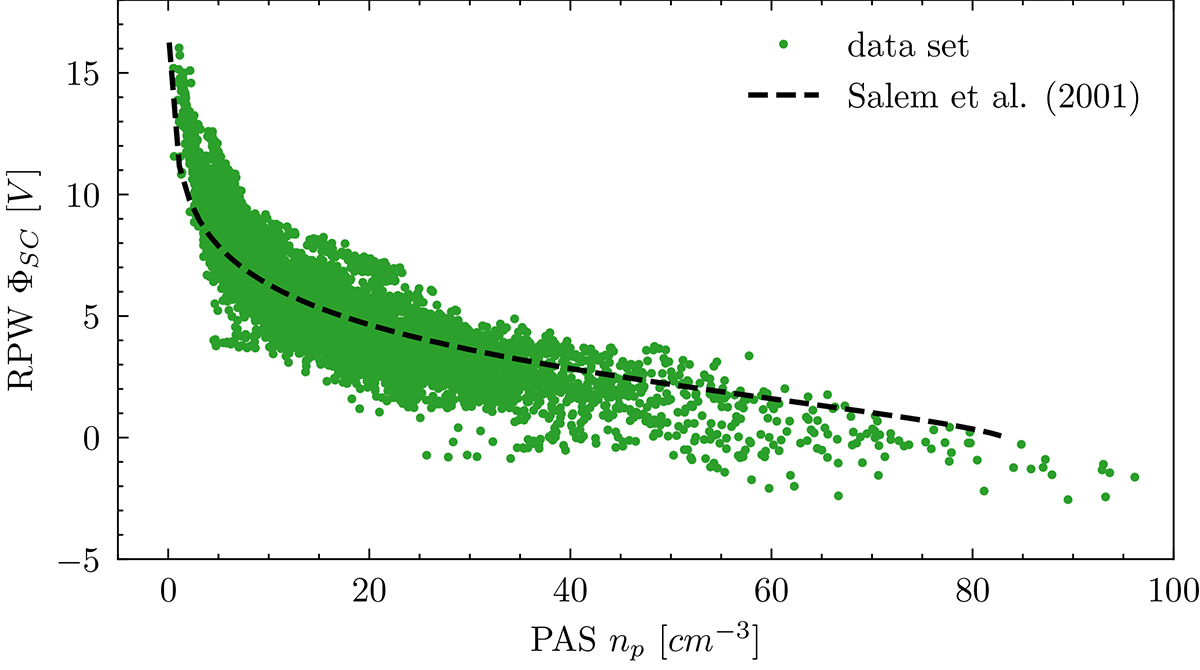
Scatter plot of RPW spacecraft potential as a function of proton density derived from PAS measurements (green dots). Data are over-plotted by a theoretical profile (dashed line) computed using Eq. (A7) in Salem et al. (2001).
Current usage metrics show cumulative count of Article Views (full-text article views including HTML views, PDF and ePub downloads, according to the available data) and Abstracts Views on Vision4Press platform.
Data correspond to usage on the plateform after 2015. The current usage metrics is available 48-96 hours after online publication and is updated daily on week days.
Initial download of the metrics may take a while.