Fig. 3.
Download original image
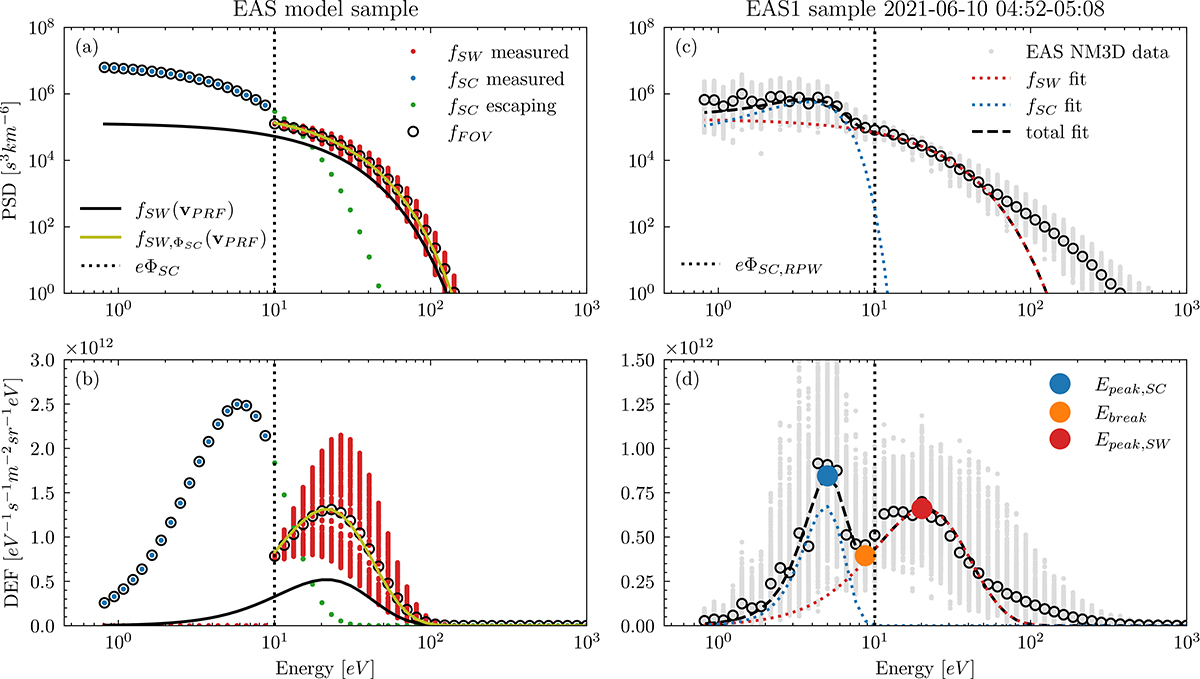
Comparison between the model and measured data for an ideal Electron Analyser System (EAS) sensor. (a) The model phase space density as a function of energy. The contribution of the ambient solar wind electrons in the plasma reference frame (PRF) is shown as the black solid line. The red dots display the ambient electron distribution as seen by the individual FOV bins of an ideal EAS detector in the spacecraft reference frame (SRF). The contribution of the spacecraft emitted electrons trapped by the spacecraft potential (escaping away from the detector) is shown by the blue (green) dots. Black empty circles display the modelled EAS response averaged for each energy over all FOV directions of the instrument. The yellow line display the contribution of the ambient electron distribution modified by the spacecraft potential energy (denoted by the black dotted line). Panel b translates the results of panel a into differential energy fluxes. (c) Real EAS data samples in phase space densities (grey dots) in a format similar to panel a. The fitted contributions of the ambient, spacecraft, and all electrons as a function of energy. plotted with red, blue, and black dashed lines, respectively. Panel d recast the results of panel c in differential energy fluxes. For further reference we show in panel d the big blue, orange, and red circles the estimated peak differential energy flux of the spacecraft electrons Epeak, SC (big blue circle), the position of the break Ebreak (big orange circle), and the estimated peak of the differential energy flux of the solar wind electrons Epeak, SW (big red circle).
Current usage metrics show cumulative count of Article Views (full-text article views including HTML views, PDF and ePub downloads, according to the available data) and Abstracts Views on Vision4Press platform.
Data correspond to usage on the plateform after 2015. The current usage metrics is available 48-96 hours after online publication and is updated daily on week days.
Initial download of the metrics may take a while.