Fig. 9.
Download original image
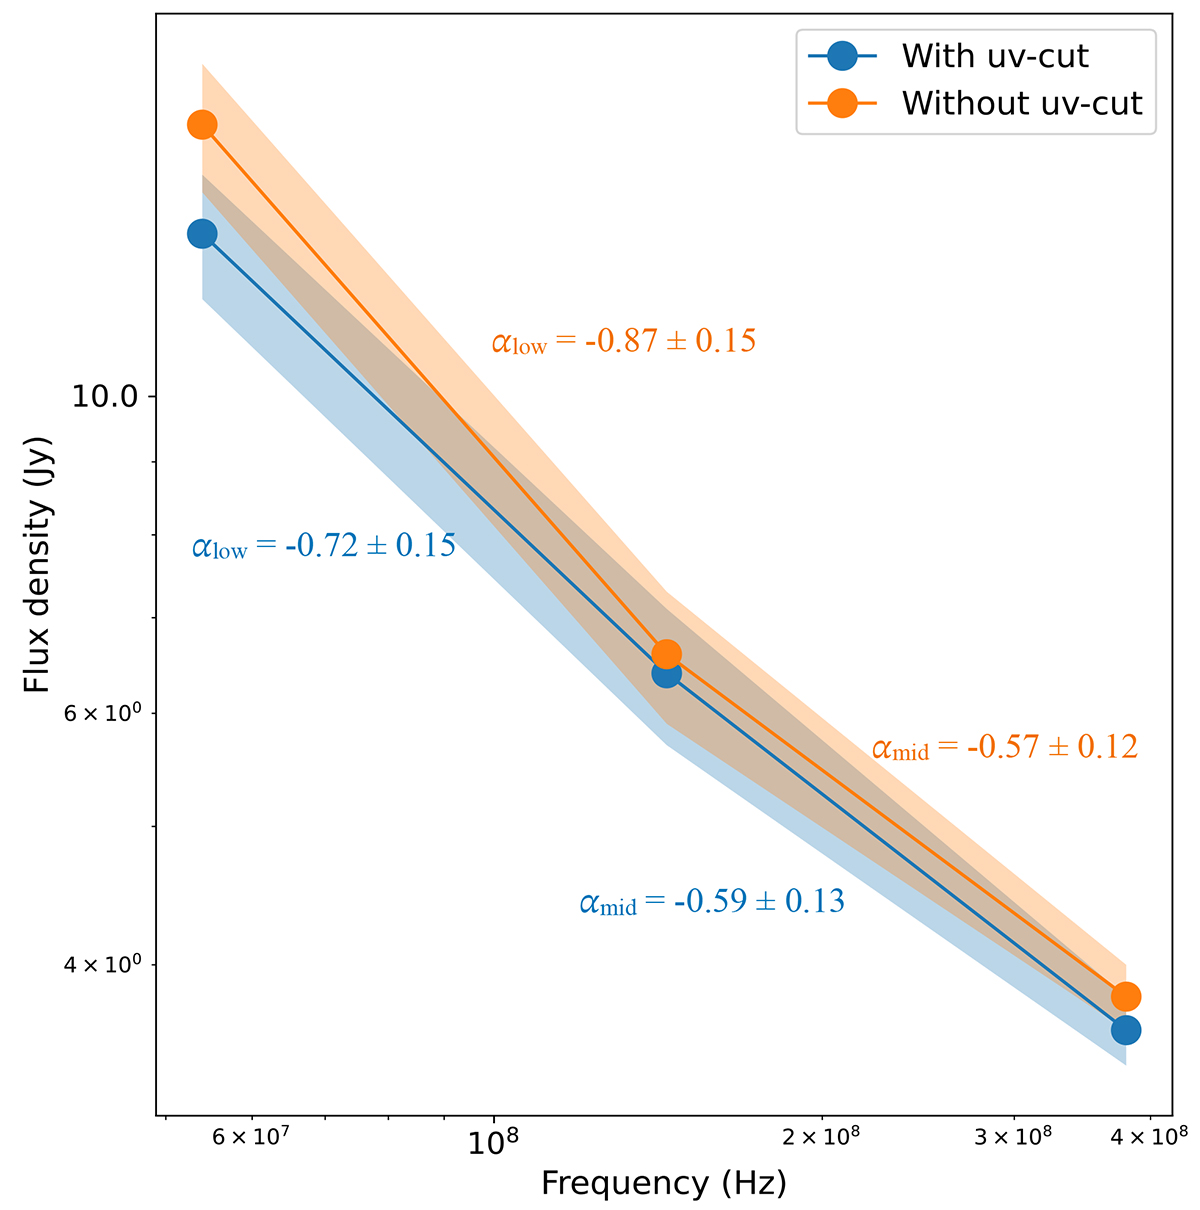
Synchrotron spectrum of 4C 29.41 between 54 and 380 MHz. The orange curve shows the case where no uv-cut was applied while imaging, thus including the contribution of extended emission, that increases the flux density especially at lower frequency. The blue curve shows instead the case with a minimum uv-cut of 1.6 kλ, which roughly corresponds to 2′ (i.e. the larger scale emission is not present).
Current usage metrics show cumulative count of Article Views (full-text article views including HTML views, PDF and ePub downloads, according to the available data) and Abstracts Views on Vision4Press platform.
Data correspond to usage on the plateform after 2015. The current usage metrics is available 48-96 hours after online publication and is updated daily on week days.
Initial download of the metrics may take a while.