Fig. 3.
Download original image
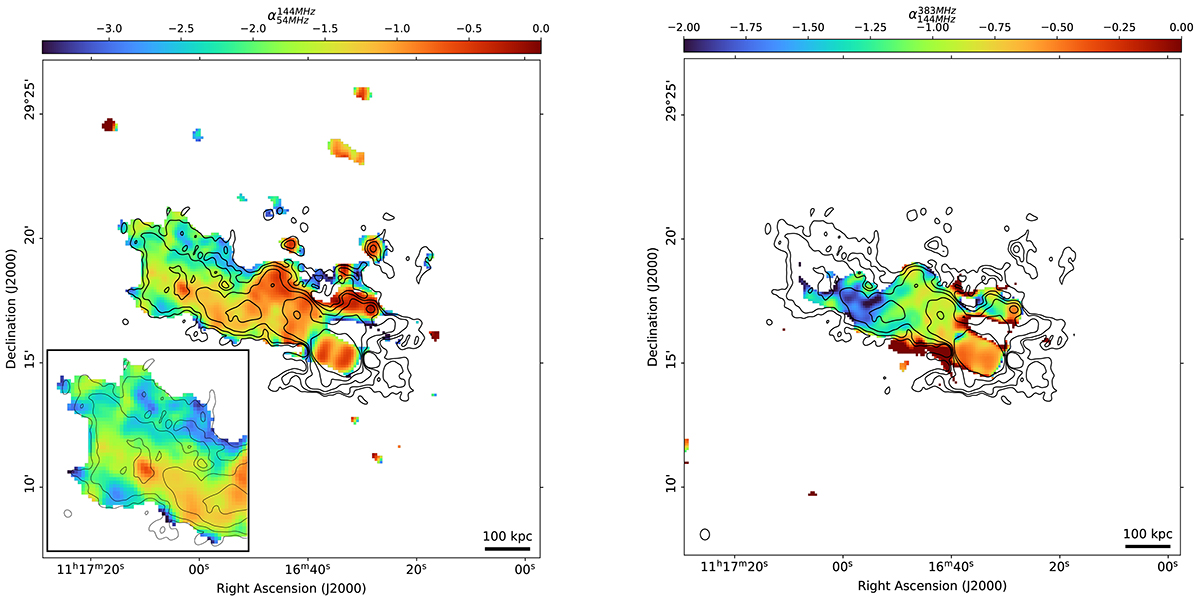
Spectral index maps of A1213. Left: Spectral index map between 54 and 144 MHz (beam 30″ × 25″). Upper limits are represented with downwards arrows. Only emission above 3σ is visible. Overlaid in black are 54 MHz contours. The bottom-left panel is a zoom on the eastern part of the tail. Right: Spectral index map between 144 and 380 MHz (beam 24″ × 19″). Only emission above 3σ is visible. Overlaid in black are 54 MHz contours. In both images, the emission to the north and south of 4C 29.41 is affected by calibration artefacts at 144 and 380 MHz and has been masked.
Current usage metrics show cumulative count of Article Views (full-text article views including HTML views, PDF and ePub downloads, according to the available data) and Abstracts Views on Vision4Press platform.
Data correspond to usage on the plateform after 2015. The current usage metrics is available 48-96 hours after online publication and is updated daily on week days.
Initial download of the metrics may take a while.