Fig. 10.
Download original image
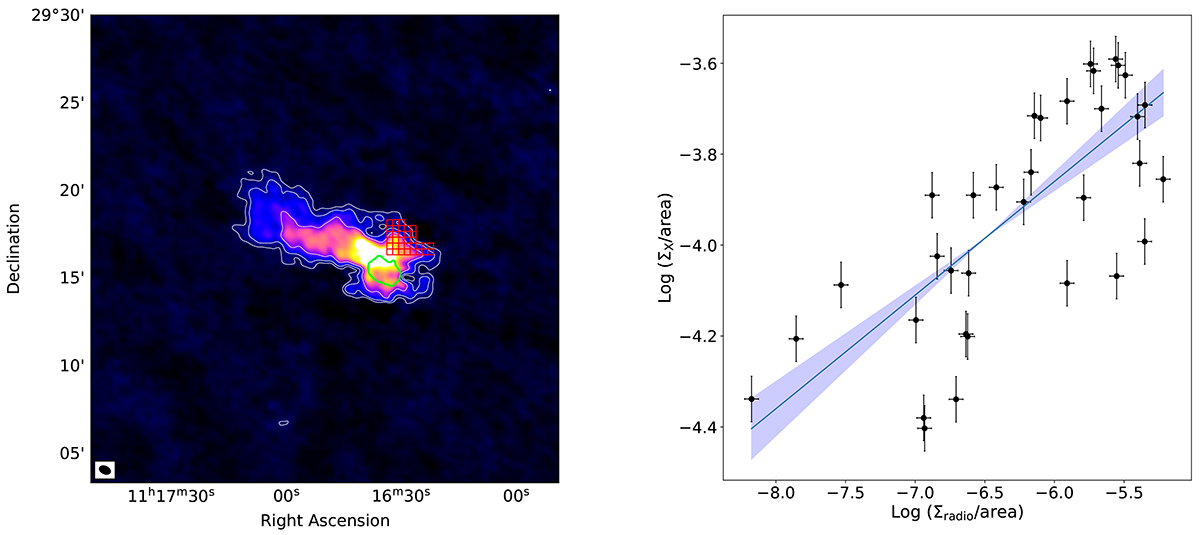
Results of the point-to-point analysis on the central region of A1213. Left: Source-subtracted map of A1213 at 54 MHz, where all sources with LLS < 250 kpc have been removed. It is not possible to remove the whole emission from 4C 29.41, which blends together with the tail and with the roundish emission in the western region. The red grid shows the region of interest of the point-to-point analysis, while the green contours encircle the region where 4C 29.41 is located. Right: Result of the point-to-point analysis between the X-ray and the LOFAR LBA source-subtracted image of A1213. The surface brightness is estimated as the sum of every pixel in each square of the grid, divided by its area. The blue line shows the best fit in the form Y = kX + A, where k = 0.25 ± 0.04 and A = −2.36 ± 0.26.
Current usage metrics show cumulative count of Article Views (full-text article views including HTML views, PDF and ePub downloads, according to the available data) and Abstracts Views on Vision4Press platform.
Data correspond to usage on the plateform after 2015. The current usage metrics is available 48-96 hours after online publication and is updated daily on week days.
Initial download of the metrics may take a while.