Fig. C2.
Download original image
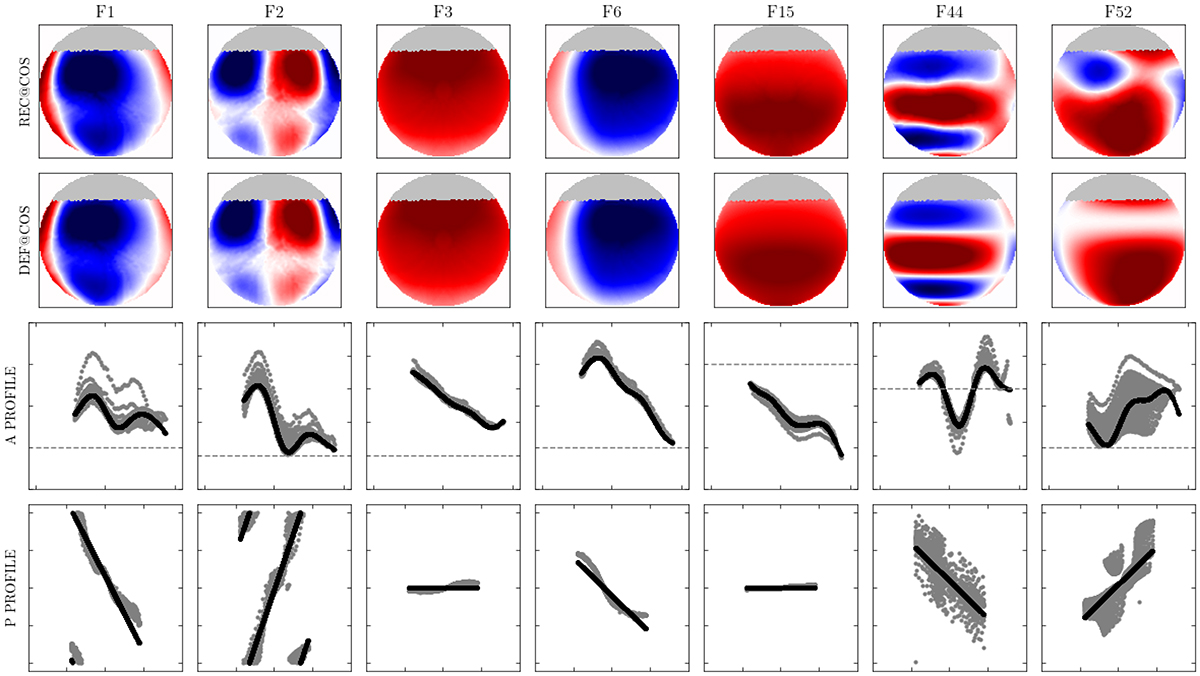
Result of eclipse-mapping reconstruction. Each column contains maps and profiles for the frequency labelled at the top of the column. The top two rows contain the reconstructed maps as seen by the observer and the corresponding ‘reference map’ holding the “rosette” symmetry content of the former. The uniformly grey polar caps represent the uneclipsed regions, the integrated signals of which were fitted by additional virtual pixels. Row 3 (from top) shows the amplitude profile in function of the stellar co-latitude, with north on the left (0 degrees) and south to the right (180 degrees). Row 4 shows the phase profile in function of the stellar longitude, from −180 to +180 degrees. Longitude 0 at the centre corresponds to the stellar meridian. The individually computed values for the pixels are plotted with grey symbols, and the values interpolated from the fitted model to the same locations are plotted in black. The axis ticks are drawn every 90 degree, except for the vertical axis of the amplitude profiles. The tick labels have been omitted from the graphs to save space. The horizontal dashed lines in the amplitude graphs mark the individual zero levels.
Current usage metrics show cumulative count of Article Views (full-text article views including HTML views, PDF and ePub downloads, according to the available data) and Abstracts Views on Vision4Press platform.
Data correspond to usage on the plateform after 2015. The current usage metrics is available 48-96 hours after online publication and is updated daily on week days.
Initial download of the metrics may take a while.