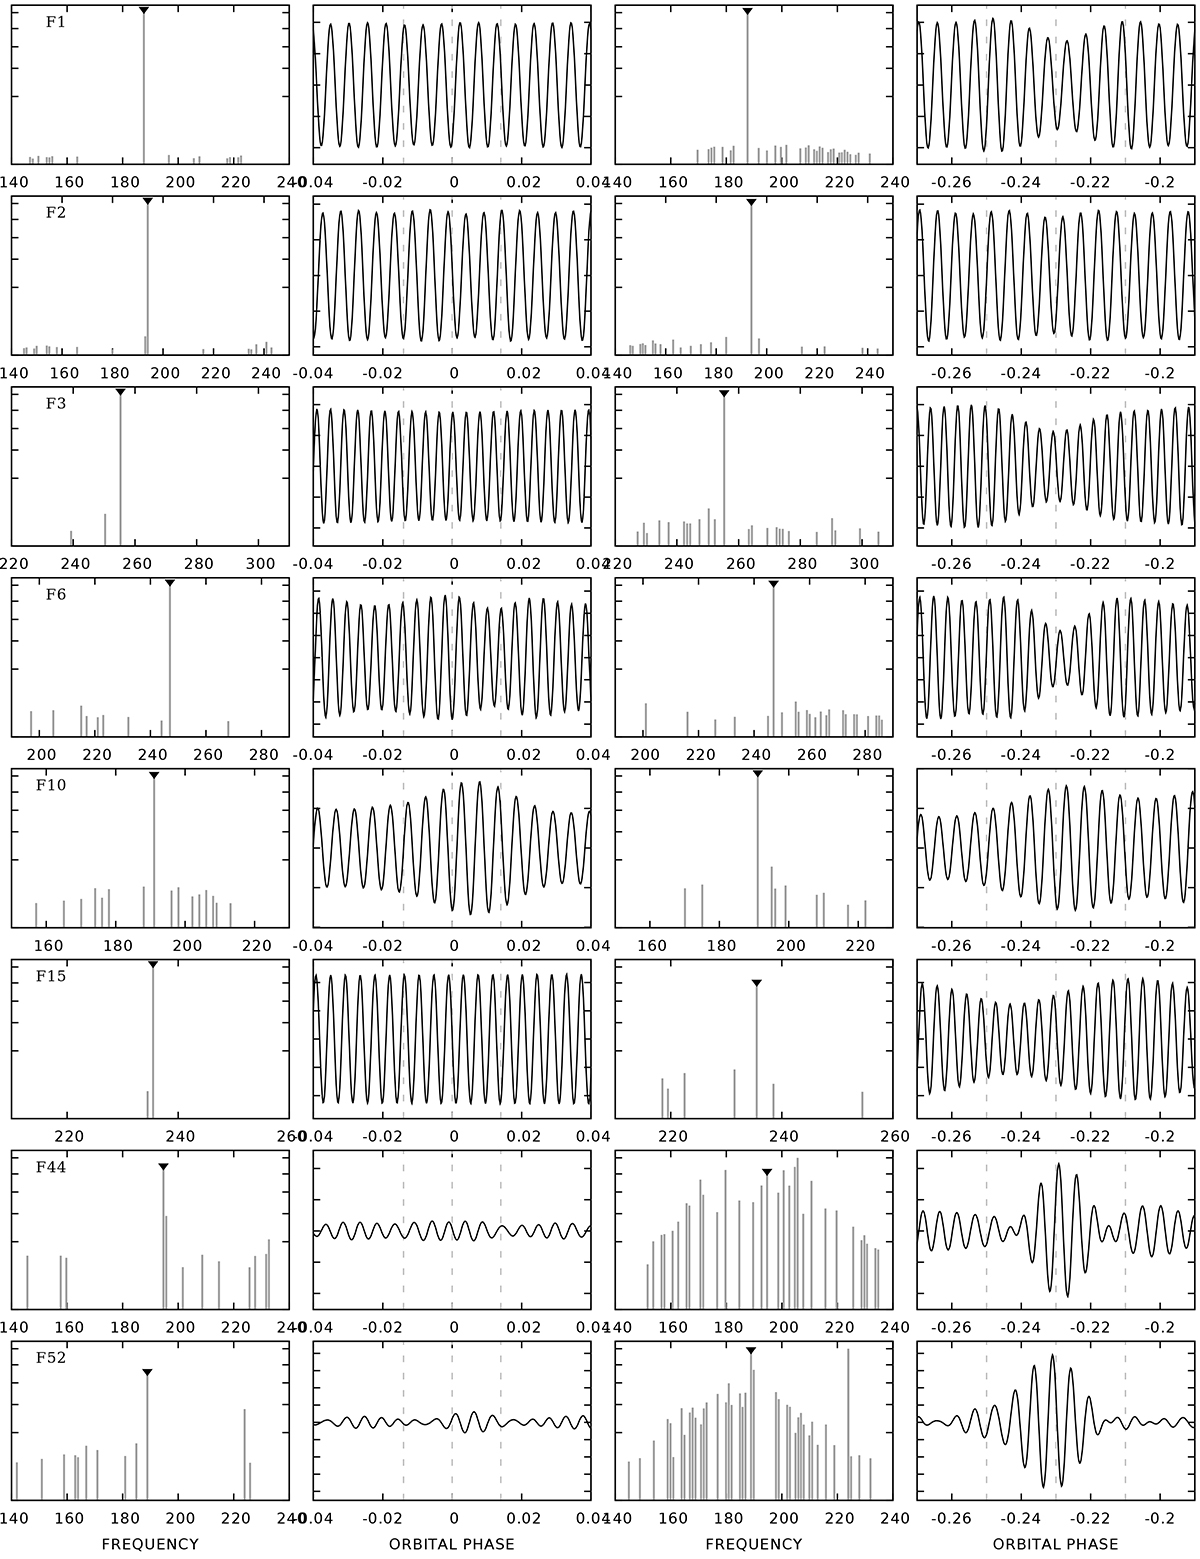
Fig. C1.
Download original image
The modulations of selected frequencies, as determined from their sidelobes identified in the ‘pri’ and ‘sec’ spectra involving primary or secondary eclipses, respectively. Every row contains data for one frequency, marked in the leftmost panels. From left to right: columns 1 and 2 – data (peaks + their synthetic signals) for primary eclipses; columns 3 and 4 – same for secondary eclipses. We note that the peak amplitudes in the frequency spectra are plotted on a nonlinear – square root – scale in order to make the smallest peaks visible. Black upside down triangles mark the central peaks. Dashed vertical lines in the light curve panels (columns 2 and 4) mark the eclipse regions.
Current usage metrics show cumulative count of Article Views (full-text article views including HTML views, PDF and ePub downloads, according to the available data) and Abstracts Views on Vision4Press platform.
Data correspond to usage on the plateform after 2015. The current usage metrics is available 48-96 hours after online publication and is updated daily on week days.
Initial download of the metrics may take a while.