Fig. 6.

Download original image
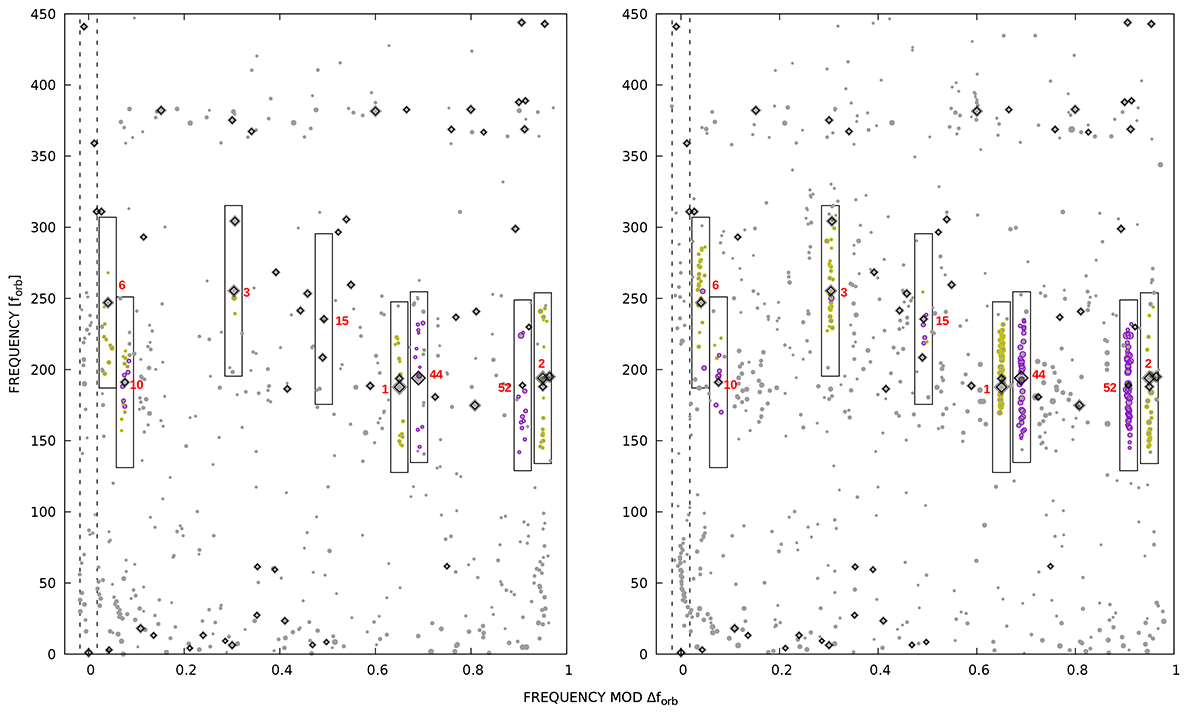
Échelle diagrams of pulsation frequencies with respect to the orbital frequency, extracted from the data including primary eclipses (left panel) and secondary eclipses (right panels). Grey filled circles mark the individual frequency peaks intrinsic to the actual dataset. Peaks common to all the three datasets are shown with the bold diagonal squares. The numbered peaks are those for which a significant amount of side peaks were found in either of the cases. The side peaks are colour coded according to the ratio of their amplitudes to that of their central peak: ratios lower than 5% are shown in yellow, the larger ones in violet. (The threshold only serves visualisation purposes). All symbol sizes are proportional to their amplitudes on a logarithmic scale. The boxes show the regions in which side peaks were searched for; their widths is equal to the fR (∼0.036), and extend vertically by 60 forb in both directions. Only F10 was found to have significant modulation during the primary eclipses. The dotted box centred on 0 shows the location where orbitally resonant frequencies and remnants of an incompletely subtracted binary signal are expected.
Current usage metrics show cumulative count of Article Views (full-text article views including HTML views, PDF and ePub downloads, according to the available data) and Abstracts Views on Vision4Press platform.
Data correspond to usage on the plateform after 2015. The current usage metrics is available 48-96 hours after online publication and is updated daily on week days.
Initial download of the metrics may take a while.


