Fig. 5.
Download original image
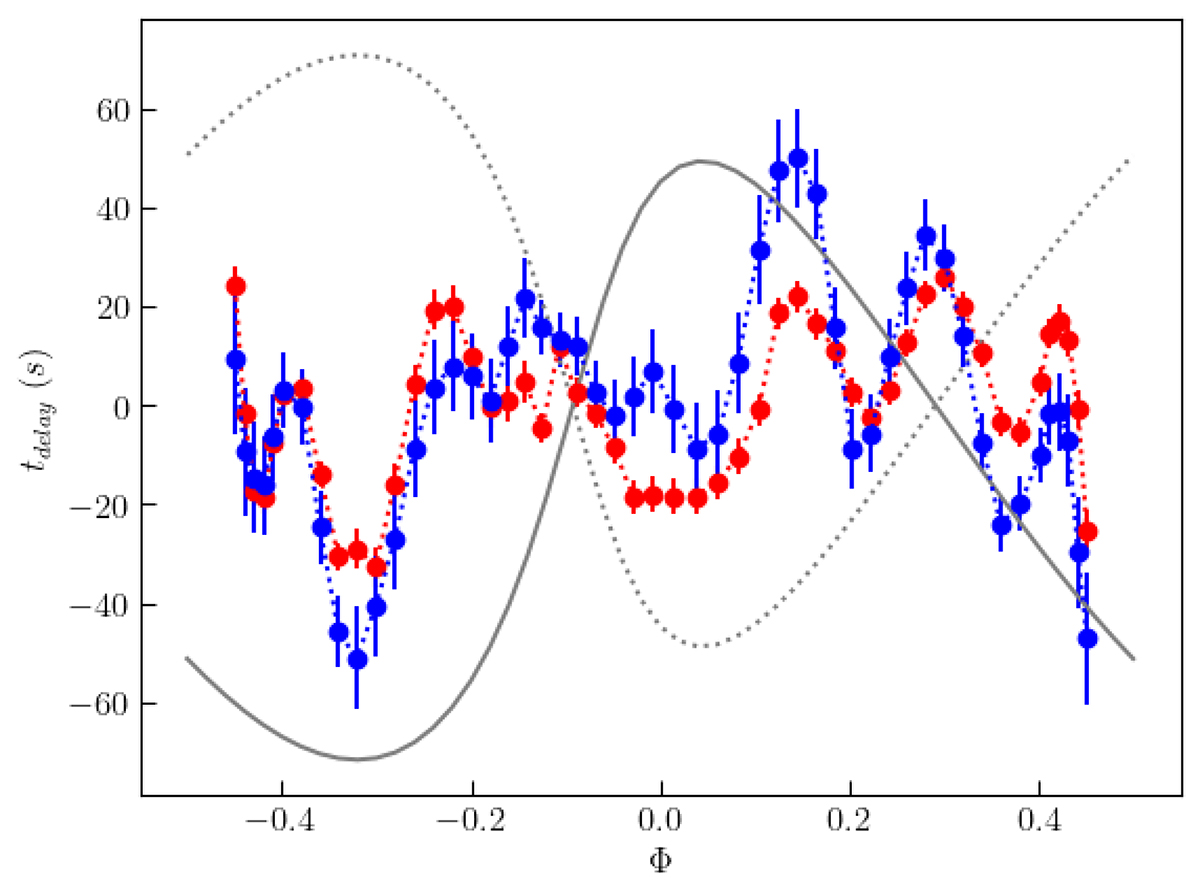
Time delays of F1 and F2 computed with the modified phase modulation method (see text for the details). The blue and red filled circles correspond to F1 (f = 187.65 forb) and F2 (f = 193.95 forb), respectively. The continuous and dotted grey lines show the theoretical time delays of the primary and secondary components, respectively, which were computed from line-of-sight distances modelled by the second generation of PHOEBE (Prša et al. 2016).
Current usage metrics show cumulative count of Article Views (full-text article views including HTML views, PDF and ePub downloads, according to the available data) and Abstracts Views on Vision4Press platform.
Data correspond to usage on the plateform after 2015. The current usage metrics is available 48-96 hours after online publication and is updated daily on week days.
Initial download of the metrics may take a while.