Fig. 4
Download original image
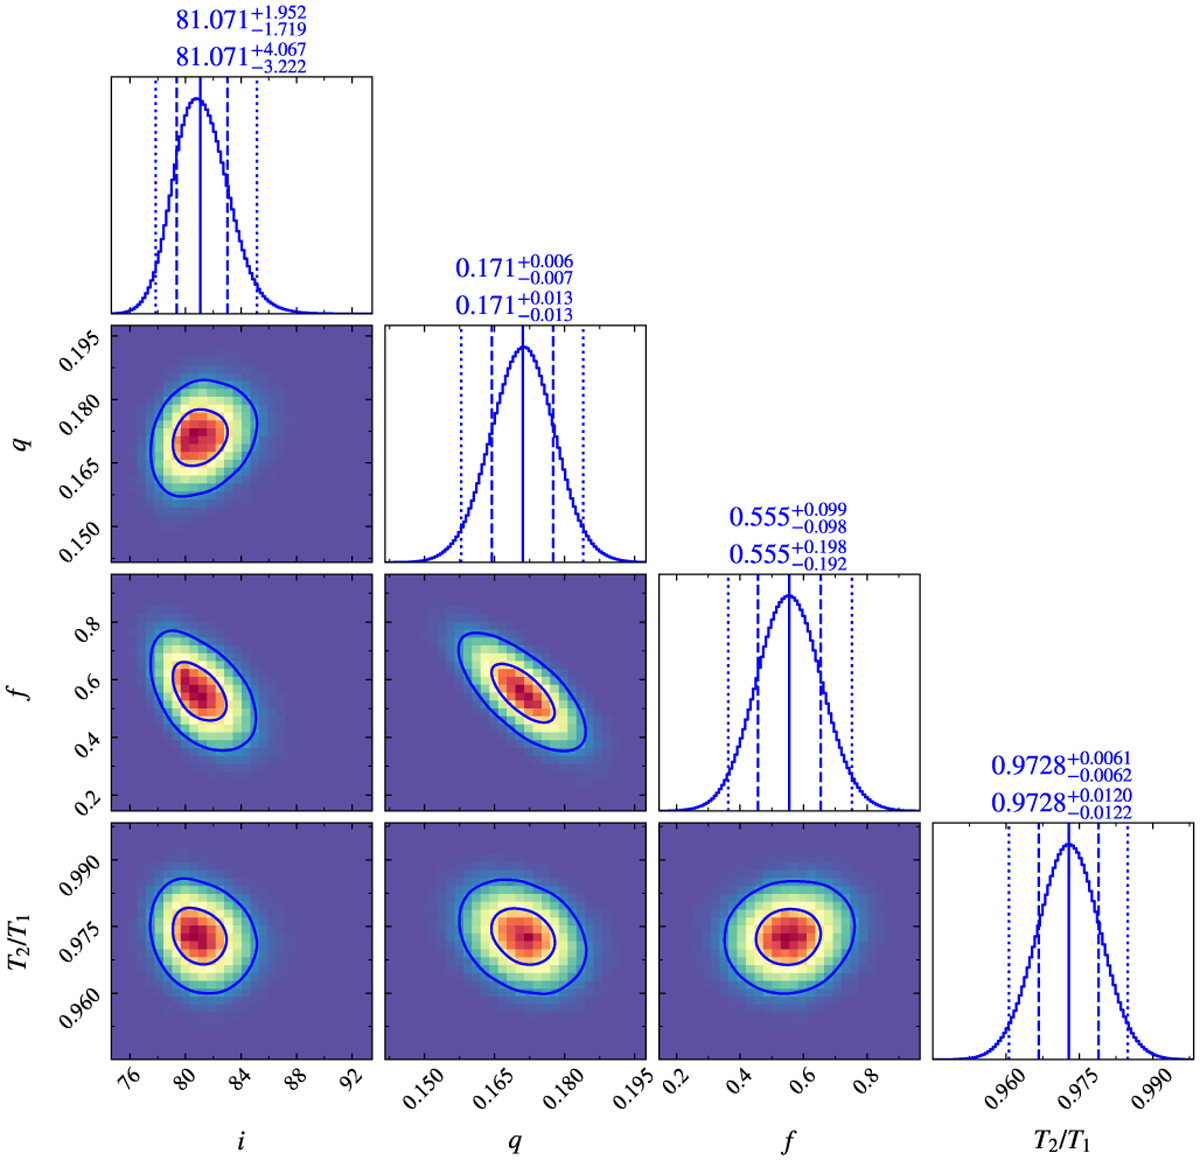
Posterior distribution of the four parameters (i, q, f, and T2/T1) for CSS_J042157.5−001751 derived using the proposed method. In each diagonal panel the solid vertical line represents the median (50th percentile) of the parameter distribution. The dashed lines indicate the 68% credible interval, while the dotted lines mark the 95% credible interval. These intervals are also reflected in the off-diagonal contour plots, with the corresponding statistical values provided above the diagonal panels, helping to determine parameter uncertainties.
Current usage metrics show cumulative count of Article Views (full-text article views including HTML views, PDF and ePub downloads, according to the available data) and Abstracts Views on Vision4Press platform.
Data correspond to usage on the plateform after 2015. The current usage metrics is available 48-96 hours after online publication and is updated daily on week days.
Initial download of the metrics may take a while.