Open Access
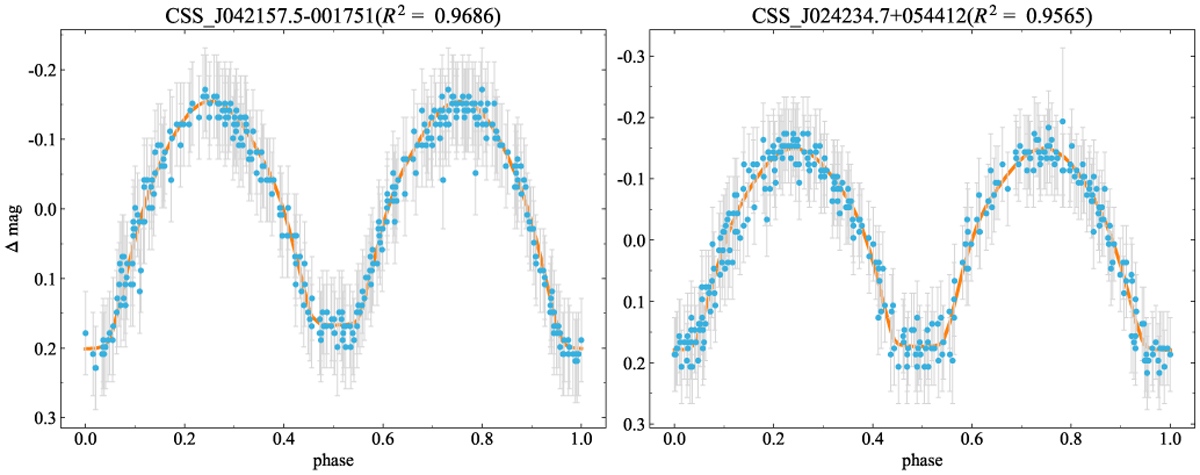
Fig. 3
Download original image
Fitting results for CSS_J042157.5−001751 and CSS_J024234.7+054412 are shown. The blue dots and gray lines represent the observed light curves with photometric errors, while the orange lines depict the light curves generated using the estimated parameters input into the PHOEBE software.
Current usage metrics show cumulative count of Article Views (full-text article views including HTML views, PDF and ePub downloads, according to the available data) and Abstracts Views on Vision4Press platform.
Data correspond to usage on the plateform after 2015. The current usage metrics is available 48-96 hours after online publication and is updated daily on week days.
Initial download of the metrics may take a while.