Fig. 2
Download original image
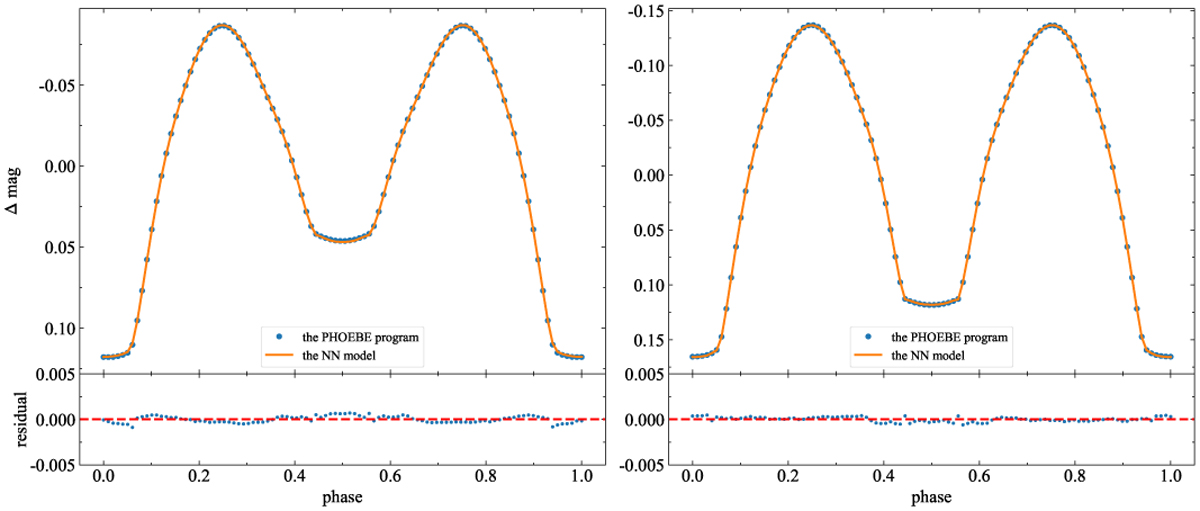
Comparison between the synthetic light curves generated by the neural network model and those produced by PHOEBE is presented. The upper panel shows the light curve generated by PHOEBE (blue line) and the one produced by the neural network model (orange line). The lower panel presents the residuals between the two curves (blue), with the red dashed line indicating the zero reference.
Current usage metrics show cumulative count of Article Views (full-text article views including HTML views, PDF and ePub downloads, according to the available data) and Abstracts Views on Vision4Press platform.
Data correspond to usage on the plateform after 2015. The current usage metrics is available 48-96 hours after online publication and is updated daily on week days.
Initial download of the metrics may take a while.