| Issue |
A&A
Volume 693, January 2025
|
|
|---|---|---|
| Article Number | A1 | |
| Number of page(s) | 8 | |
| Section | Astrophysical processes | |
| DOI | https://doi.org/10.1051/0004-6361/202451986 | |
| Published online | 23 December 2024 | |
Impact of nuclear mass models on r-process nucleosynthesis and heavy element abundances in r-process-enhanced metal-poor stars
1
Kavli Institute for Astronomy and Astrophysics, Peking University, Beijing 100871, China
2
Guangxi Key Laboratory for Relativistic Astrophysics, School of Physical Science and Technology, Guangxi University, Nanning 530004, China
3
Guangxi Key Laboratory of Nuclear Physics and Technology, Department of Physics, Guangxi Normal University, Guilin 541004, China
⋆ Corresponding authors; physcmh@pku.edu.cn, lew@gxu.edu.cn
Received:
26
August
2024
Accepted:
21
November
2024
Because we lack experimental data on extremely neutron-rich nuclei, theoretical values derived from nuclear physics models are essential for the rapid neutron-capture process (r-process). Metal-poor stars enriched by the r-process offer valuable cases for studying the impact of nuclear physics models on r-process nucleosynthesis. This study analyzes four widely used nuclear physics models in detail: the finite-range droplet model, the Hartree-Fock-Bogoliubov, the Duflo-Zuker, and the Weizsäcker-Skyrme model. Theoretical values predicted by the Weizsäcker-Skyrme model are found to agree well with experimental data, and the deviations are significantly smaller than those predicted by other models. The heavy element abundances observed in r-process-enhanced metal-poor stars can be accurately reproduced by r-process nucleosynthesis simulations using the Weizsäcker-Skyrme model, particularly for the rare-earth elements. This suggests that nuclear data provided by a nuclear physics model such as that of Weizsäcker-Skyrme are both essential and crucial for r-process nucleosynthesis studies.
Key words: nuclear reactions / nucleosynthesis / abundances
© The Authors 2024
 Open Access article, published by EDP Sciences, under the terms of the Creative Commons Attribution License (https://creativecommons.org/licenses/by/4.0), which permits unrestricted use, distribution, and reproduction in any medium, provided the original work is properly cited.
This article is published in open access under the Subscribe to Open model. Subscribe to A&A to support open access publication.
1. Introduction
The rapid neutron-capture process (r-process) has long been considered the primary mechanism that produces heavy elements beyond iron in the Universe (Burbidge et al. 1957). The reaction conditions for the r-process require a high density and temperature, as well as extremely neutron-rich environments. The ejected materials from the merger of binary neutron stars or neutron star-black hole systems are ideal sites for r-process nucleosynthesis (Lattimer & Schramm 1974; Symbalisty & Schramm 1982). In 1998, Li & Paczyński (1998) first predicted that the radioactive decay of freshly synthesized heavy elements via r-process nucleosysnthesis could power a bright thermal transient known as a kilonova (Metzger et al. 2010). This r-process kilonova model was confirmed by multimessenger observations of the first neutron star merger event GW170817/GRB170817A/AT2017gfo (Abbott et al. 2017). The light curve and color evolution of kilonova AT2017gfo suggest that approximately 0.05 M⊙ of heavy r-process nuclei were synthesized in this merger event (Kasen et al. 2017; Chen & Liang 2024). If the heavy element yield in the kilonova AT2017gfo can be regarded as typical for neutron star mergers, merger events like this might be the dominant contributor to the production of heavy r-process elements in the Universe (Hotokezaka et al. 2018; Chen et al. 2024a).
The detection of kilonova emission supports the prediction that neutron star mergers are astrophysical sites of r-process nucleosynthesis, but it remains a great challenge to determine the detailed composition of heavy elements in the merger ejecta. Watson et al. (2019) analyzed spectral features in the kilonova AT2017gfo and identified the individual heavy element strontium (atomic number Z = 38). Recently, Levan et al. (2024) identified the heavier element tellurium (atomic number Z = 52) in the kilonova associated with the gamma-ray burst 230307A observed by the James Webb Space Telescope. Another direct approach to identifying heavy elements could be the observation of gamma-ray lines produced by the radioactive decay in the merger ejecta (Hotokezaka et al. 2016; Li 2019; Wang et al. 2020; Chen et al. 2021, 2022, 2024b; Vassh et al. 2024). Unfortunately, current MeV gamma-ray detectors are not sufficient to detect these radioactive gamma-ray lines (Chen et al. 2021, 2022, 2024b).
The heavy elements ejected by neutron star mergers enrich the interstellar medium and contribute to the formation of next-generation stars (Sneden et al. 2008). Consequently, the detailed composition of these heavy elements has been recorded in some stars that are enriched by a single r-process event, such as r-process-enhanced metal-poor stars (Sneden et al. 2008). To date, a total of eight r-process-enhanced metal-poor stars with both thorium (Th, Z = 90) and uranium (U, Z = 92) have been detected. These are CS 31082–001 (Hill et al. 2002), BD +17°3248 (Cowan et al. 2002), HE 1523–0901 (Frebel et al. 2007), CS 29497–004 (Hill et al. 2017), J2038–0023 (Placco et al. 2017), J0954+5246 (Holmbeck et al. 2018), J2003–1142 (Yong et al. 2021), and J2213-5137 (Roederer et al. 2024). According to the Th/U nuclear chronometer, the ages of these stars are consistent with a cosmic age of 13.8 billion years (Wu et al. 2022), suggesting that they were polluted by only a single r-process event. In this work, we study the detailed heavy element abundances using the r-process nuclear reaction network and the astrophysical parameters derived from numerical relativity simulations. We compare them with the observed abundances in r-process-enhanced metal-poor stars.
The r-process-enhanced metal-poor stars provide valuable examples for studying the impact of nuclear physics models on r-process nucleosynthesis (Niu et al. 2009). The path of r-process nucleosynthesis nearly reaches the neutron drip line, which is far away from the valley of stability. These extremely neutron-rich nuclei remain beyond current experimental capabilities, and their properties are often unmeasured (Mumpower et al. 2016; Horowitz et al. 2019; Kajino et al. 2019). Consequently, theoretical values derived from nuclear physical models are essential for r-process calculations. While nuclear physics models generally reproduce experimental values for measured nuclei, the predictions for extremely neutron-rich and unmeasured nuclei can vary significantly among different models (see a review by Mumpower et al. 2016 and references therein). As a result, the abundance patterns of heavy elements calculated by using different nuclear physics models vary significantly (Eichler et al. 2015; Mendoza-Temis 2015; Mumpower et al. 2015; Zhu et al. 2021; Chen et al. 2023), especially in the region of rare-earth elements from La (Z = 57) to Lu (Z = 71) (Surman & Engel 2001; Arcones & Martínez-Pinedo 2011; Mumpower et al. 2012, 2016; Hao et al. 2023). In the observation of metal-poor stars, heavy elements from Ba (Z = 56) to Hf (Z = 72) can be effectively identified from the observed spectrum. Therefore, it is worthwhile to study the impact of nuclear physics models on r-process nucleosynthesis and to compare the calculated with the observed abundances in very metal-poor stars that were polluted by a single r-process event. In this work, we select eight r-process-enhanced metal-poor stars for which both Th and U were detected, as these actinides are pure r-process products that can only be formed via r-process nucleosynthesis. We compare the heavy element abundances obtained from different nuclear physics models with those observed in r-process-enhanced metal-poor stars to explore the impact of nuclear physics inputs on r-process nucleosynthesis.
This paper is organized as follows. In Sect. 2 we provide details on the nuclear physics inputs and the r-process nucleosynthesis simulations. Section 3 compares the r-process abundances from neutron star mergers with those observed in r-process-enhanced metal-poor stars. Finally, the summary is provided in Sect. 4.
2. Methods
To study the nucleosynthesis of heavy elements in neutron star mergers, we used the nuclear reaction network code SkyNet to perform r-process nucleosynthesis simulations. SkyNet was developed at Los Alamos National Laboratory by Lippuner & Roberts (2017) and has been widely used for r-process nucleosynthesis in core-collapse supernovae and neutron star mergers. The network contains more than 7800 nuclide species and includes over 140 000 nuclear reactions. The reaction rates used in SkyNet were taken from the JINA REACLIB database (Cyburt et al. 2010). Nuclear data were taken from the WebNucleo XML file distributed with REACLIB, and the nuclear masses are consistent with the finite-range droplet model provided by Möller et al. (1995).
The r-process nucleosynthesis simulations depend on theoretical results derived from nuclear physics models because in the early stages of the r-process, a significant number of extremely neutron-rich nuclei is produced by the neutron-capture process. In Fig. 1 we show the typical features of the abundance distribution in the early stages of the r-process simulations. For comparison, the latest measured nuclear mass data from AME2020 database (Wang et al. 2021) are also shown. The path of the r-process lies on the extremely neutron-rich side, far away from the valley of stable nuclei. These extremely neutron-rich nuclei cannot be produced in the laboratory, and their properties are unmeasured. Therefore, theoretical predictions from nuclear physics models play a crucial role in r-process nucleosynthesis simulations (see recent reviews, e.g., by Cowan et al. 2021; Arcones & Thielemann 2023, and references therein).
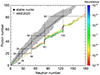 |
Fig. 1. Comparison of typical features of the r-process path with the latest measured nuclei from the AME2020 database. The abundance distribution corresponds to the early stages of r-process nucleosynthesis at t = 0.2 s, when the neutron capture process has begun. Our nucleosynthesis calculations started when the temperature dropped below T = 6 × 10⁹ K. The astrophysical parameters are typical for binary neutron star mergers: The electron fraction Ye = 0.10, the specific entropy s = 10 kB/baryon, and the expansion timescale τ = 10 ms. The horizontal and vertical black lines indicate closed proton and neutron shell nuclei, respectively. |
In order to reduce the uncertainty caused by nuclear physics inputs, we updated the nuclear data with modern databases, including the latest nuclear mass data from AME2020 (Wang et al. 2021) and the latest nuclear decay data from NUBASE2020 (Kondev et al. 2021). For nuclei without experimental data, we used theoretical values from widely used nuclear mass models, which are the Finite-Range Droplet Model (FRDM2012; Möller et al. 2012, 2016), the Hartree-Fock-Bogoliubov (HFB27; Goriely et al. 2009, 2013), the Duflo-Zuker (DZ31; Duflo & Zuker 1995), and the Weizsäcker-Skyrme model (WS4; Wang et al. 2010, 2014). The FRDM2012 is the most popular model and is based on a macroscopic-microscopic approach, where the macroscopic part treats the nucleus as a deformed liquid droplet, and the microscopic part accounts for nuclear shell correction and the pairing effect (Möller et al. 2016). The HFB27 model, which is a leading example of a fully microscopic approach, predicts nuclear masses based on the Skyrme energy density functional theory (Goriely et al. 2013). The DZ31 model is an empirical formula that successfully describes nuclear masses across a wide range of nuclei (Duflo & Zuker 1995). The WS4 model is the most recent and improved version of the macroscopic-microscopic approach, which uses the Skyrme energy density functional and accounts for the surface diffuseness effect in neutron-rich nuclei (Wang et al. 2014). These four nuclear physics models can predict nuclear masses for extremely neutron-rich nuclei and have been widely used in r-process simulations.
Figure 2 presents the deviations between theoretical nuclear mass values predicted by various models and experimental values reported in the AME2020 database. The solid circles indicate the newly measured nuclei that are included in the AME2020 database, but are absent from the previous AME2016 database (Wang et al. 2017). These newly measured data provide a unique opportunity to test the predictive power of nuclear physics models, as theoretical models predicted these masses prior to measurement. The deviations between theoretical mass models and experimental data are generally within 3 MeV. The nuclear masses predicted by the WS4 model agree better with the experimental data than those from the other three mass models. This indicates that the WS4 model is both powerful and effective in predicting nuclear masses for unknown nuclei.
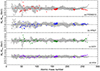 |
Fig. 2. Deviations between theoretical values from nuclear mass models and experimental values in the AME2020 database. Four widely used nuclear mass models are considered: FRDM2012, HFB27, DZ31, and WS4. The solid circles represent newly measured nuclei that are included in the AME2020, but not in the previous AME2016. |
To quantify the predictive power of nuclear physics models, we calculated the root-mean-square (rms) deviation between theoretical and experimental values as
where Mith and Miexp are the theoretical and experimental values of the ith nuclear species, respectively, and n is the total number of nuclide species. Table 1 lists the rms deviations between theoretical mass values from various models and experimental values from the AME2020 database.
Comparison of the rms deviations between theoretical values from nuclear physics models and experimental data in the AME2020 database.
The reaction rates of the neutron-capture process (n, γ) were recalculated using updated nuclear masses with the Hauser-Feshbach statistical code TALYS (Goriely et al. 2008). TALYS provides a detailed description of astrophysical reaction rates in the temperature range from 108 to 1010 K. The calculated reaction rates λ were then converted into a polynomial format consistent with the REACLIB database,

where T9 = 109 K, and the coefficients a0 ∼ a6 were obtained using the least-squares fitting method in logarithmic space. The inverse reaction rates (γ, n) were calculated by detailed balance. Nuclear fission rates were calculated using fission barriers from Möller et al. (2015) and fission fragment distributions from Kodama & Takahashi (1975).
The rms deviation between neutron-capture rates based on theoretical models and those based on experimental data can be written as
where λith and λiexp are the theoretical and experimental neutron-capture rates for the ith nuclide species, respectively.
Since this study focuses on the impact of nuclear physics inputs on r-process nucleosynthesis simulations, we adopted parameterized trajectories as astrophysical inputs. Astrophysical parameters were taken from numerical relativity simulations provided by Radice et al. (2018). Table 2 lists the astrophysical parameters adopted in our r-process nucleosynthesis simulations. The astrophysical parameters for disk wind ejecta are broadly consistent with those in Nedora et al. (2021), with an electron fraction of Ye = 0.3, a specific entropy of s = 20 kB/baryon, and an expansion velocity of v = 0.15c. The density profile adopts the analytical expression consistent with Lippuner & Roberts (2015), which initially decreases exponentially with time, that is, ρ ∝ e−t, and then smoothly transitions to a homologous expansion, ρ ∝ t−3. The evolution of temperature is influenced by both the nuclear equation of state and self-heating from nuclear reactions. In our simulations, the r-process started when the temperature dropped below 6 × 10⁹ K and ended at t = 109 s, by which time the majority of radioactive nuclei have decayed into stable elements.
Astrophysical parameters for the r-process simulations.
The rms deviation for the abundances of r-process elements is given by
where Yical is the calculated abundances using nuclear physics models, and Yiobs is the observed abundances in r-process-enhanced metal-poor stars.
3. Results and analysis
Figure 3 shows the deviations of neutron-capture rates calculated using theoretical mass values from various models compared to those based on experimental values from the AME2020 database. The neutron-capture rates calculated with the WS4 model agree well with those based on experimental values, and the results from the WS4 model are significantly more accurate than those from the other three nuclear physics models. The deviations of the neutron-capture rates in the WS4 model are within the same order of magnitude as the experimental values, including those for newly measured nuclei.
To further analyze the neutron-capture rates calculated using various nuclear physics models, we compared the results for each nuclide species, as shown in Fig. 4. In the region of the measured nuclei, the neutron-capture rates from different models are generally consistent. However, in the region approaching the r-process path, the neutron-capture rates calculated using different models exhibit significant deviations that reach up to one order of magnitude. Table 1 lists the rms deviations of the neutron-capture rates based on different nuclear physics models compared to those based on experimental values. The rms deviations of the WS4 model for both total and newly measured nuclei are approximately 0.3, indicating that the overall discrepancy between the neutron-capture rates based on theoretical values and those based on experimental data is within a factor of 100.3 ≈ 2.
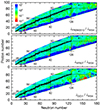 |
Fig. 4. Comparison of the neutron-capture rates for each nucleus calculated using various nuclear physics models. |
Since we converted the neutron capture rates obtained using the TALYS method into a polynomial format consistent with the REACLIB database, it is necessary to examine the deviations between the fitting results and the original TALYS calculations. Figure 5 shows the deviations between the neutron-capture rates obtained from the fitted polynomial and those directly calculated using the TALYS code. The neutron-capture rates shown in the figure are based on nuclear mass values from the WS4 model. The neutron-capture rates derived from the fitted polynomial agree well with those directly calculated by the TALYS code.
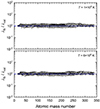 |
Fig. 5. Deviations between the neutron-capture rates obtained using the fitted polynomial format and those calculated with the TALYS code. The neutron-capture rates are shown at temperatures of 1 × 10⁹ K (top panel) and 6 × 10⁹ K (bottom panel). The nuclear mass values are based on the WS4 model. |
We used updated nuclear physics inputs to explore their impact on r-process nucleosynthesis simulations. Figure 6 shows the abundance patterns of r-process elements as simulated with different nuclear physics inputs. For comparison, the solar r-process abundances from Arnould et al. (2007) are shown. The astrophysical parameters for the r-process simulations are listed in Table 2. The abundance patterns from r-process simulations are broadly consistent with the solar r-process abundances, particularly in the regions of the second and third r-process peaks. However, for nuclei in the region of rare-earth elements (with atomic mass numbers 140 ≤ A ≤ 180), the abundances calculated using the FRDM2012 model are lower than those from the other three nuclear physics models. This discrepancy may be attributed to the significant differences in nuclear mass values and neutron-capture rates obtained using the FRDM2012 model compared to those calculated with the other three nuclear physics models. To determine the impact of individual nuclear properties on r-process simulations, it is necessary to vary each nuclear property and study its sensitivity to the element abundances (Mumpower et al. 2016).
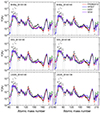 |
Fig. 6. Abundance patterns of r-process elements produced by neutron star mergers at t = 109 s. The solar r-process abundances from Arnould et al. (2007) are shown for comparison. The astrophysical parameters used in the simulations are detailed in Table 2. |
The r-process-enhanced metal-poor stars provide robust cases for studying the impact of nuclear physics models on r-process simulations, particularly for nuclei in the rare-earth element region. We compared the r-process abundances from neutron star mergers with those observed in r-process-enhanced metal-poor stars, as shown in Fig. 7. We note that it is difficult to distinguish between different isotopes in the observations of metal-poor stars, and thus, the x-axis in the figure represents the atomic number rather than the atomic mass number. The element abundances of r-process-enhanced metal-poor stars were scaled to Y(Z = 63) = 5.0 × 10⁻⁵. The r-process abundances calculated using the FRDM2012 model are generally lower than those observed in r-process-enhanced metal-poor stars, except for Th and U. The observed abundances of metal-poor stars are well reproduced by the r-process simulations using the WS4 model. Additionally, the odd-even effect in the heavy element abundances of r-process-enhanced metal-poor stars is also well reproduced, where the abundances of odd-Z nuclei are slightly lower than those of their neighboring even-Z nuclei. In Table 3, we present the rms deviations between the simulated abundances from various nuclear physics models and the observed abundances in r-process-enhanced metal-poor stars. The WS4 model in r-process nucleosynthesis simulations can more accurately reproduce the r-process abundances observed in metal-poor stars compared to other three nuclear physics models.
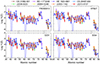 |
Fig. 7. Comparison of the r-process abundances from neutron star mergers with those observed in r-process-enhanced metal-poor stars. Eight r-process-enhanced metal-poor stars are considered: CS 31082–001 (Hill et al. 2002), BD +17°3248 (Cowan et al. 2002), HE 1523–0901 (Frebel et al. 2007), CS 29497–004 (Hill et al. 2017), J2038–0023 (Placco et al. 2017), J0954+5246 (Holmbeck et al. 2018), J2003–1142 (Yong et al. 2021), and J2213–5137 (Roederer et al. 2024). The element abundances of these stars are scaled to Y(Z = 63) = 5.0 × 10⁻⁵. The blue lines represent the average abundances across the astrophysical models for neutron star mergers. |
Comparison of the rms deviations between simulated abundances from various nuclear physics models and observed abundances in r-process-enhanced metal-poor stars.
4. Summary
The rapid neutron-capture process (r-process) involves a significant number of extremely neutron-rich and unmeasured nuclei, and thus, it relies heavily on theoretical predictions provided by nuclear physics models (Fig. 1). Several metal-poor stars were observed with a detailed composition of r-process elements. They are valuable cases for studying the impact of nuclear physics inputs on r-process nucleosynthesis. We conducted a detailed comparison between the r-process abundances calculated using a nuclear reaction network with various nuclear physics models and the observed abundances in r-process-enhanced metal-poor stars. This provided insights into the predictive power of these models and their impact on r-process nucleosynthesis.
First, we compared the theoretical values from nuclear physics models with the experimental values from the latest AME2020 database. The nuclear masses predicted by the Weizsäcker-Skyrme (WS4) model agree well with experimental data, especially for the newly measured nuclei (Fig. 2). The root-mean-square (rms) deviation between theoretical values from the WS4 model and experimental values from the AME2020 database is ∼0.3 MeV, which is significantly smaller than those from other nuclear mass models. This indicates that the WS4 model is both powerful and effective in predicting nuclear masses for unknown nuclei.
Second, we analyzed the neutron-capture rates calculated using theoretical values from various nuclear physics models and compared them with those based on experimental data. In the region of measured nuclei, the neutron-capture rates from different models are generally consistent. However, in the region approaching the r-process path, the neutron-capture rates calculated using different models exhibit significant deviations that reach up to one order of magnitude (Fig. 4). The neutron-capture rates calculated with the WS4 model agree well with those based on experimental values (Fig. 3).
Finally, we studied the r-process abundances using a nuclear reaction network with updated nuclear physics inputs and compared these results with the abundances observed in r-process-enhanced metal-poor stars. The WS4 model reproduces the r-process abundances observed in metal-poor stars better than the other three nuclear physics models (Fig. 7), particularly in the region of rare-earth elements from La (Z = 57) to Lu (Z = 71). The odd-even effect in the heavy element abundances of r-process-enhanced metal-poor stars is also well reproduced, where the abundances of odd-Z nuclei are slightly lower than those of their neighboring even-Z nuclei. The reason may be that the nuclear physics inputs (i.e., nuclear mass values and neutron capture rates) derived from the WS4 model agree well with those based on experimental data. These results suggest that the WS4 model plays a crucial role in r-process nucleosynthesis simulations, especially in studies that require a quantitative analysis of elemental abundances, such as age determinations of metal-poor stars using Th/U nuclear chronometry (Wu et al. 2022).
In summary, the WS4 model not only provides precise predictions for nuclear properties, but also plays a crucial role in r-process nucleosynthesis simulations. Therefore, we recommend using the theoretical values from the WS4 model as nuclear physics inputs for r-process nucleosynthesis simulations. The nuclear mass table for the WS4 model, provided by Wang et al. (2014), is available at http://www.imqmd.com/mass/.
Acknowledgments
We thank Hui-Ling Chen for valuable discussions. This work was supported by the National Natural Science Foundation of China (Grant Nos. 11973014, 12133003, 12347172, 12403043, and 12473038). M.H.C. also acknowledges support from the China Postdoctoral Science Foundation (Grant Nos. GZB20230029 and 2024M750057). This work was also supported by the Guangxi Talent Program (Highland of Innovation Talents).
References
- Abbott, B. P., Abbott, R., Abbott, T. D., et al. 2017, ApJ, 848, L12 [Google Scholar]
- Arcones, A., & Martínez-Pinedo, G. 2011, Phys. Rev. C, 83, 045809 [CrossRef] [Google Scholar]
- Arcones, A., & Thielemann, F.-K. 2023, A&ARv, 31, 1 [NASA ADS] [CrossRef] [Google Scholar]
- Arnould, M., Goriely, S., & Takahashi, K. 2007, Phys. Rep., 450, 97 [Google Scholar]
- Burbidge, E. M., Burbidge, G. R., Fowler, W. A., & Hoyle, F. 1957, Rev. Mod. Phys., 29, 547 [NASA ADS] [CrossRef] [Google Scholar]
- Chen, M.-H., & Liang, E.-W. 2024, MNRAS, 527, 5540 [Google Scholar]
- Chen, M.-H., Li, L.-X., Lin, D.-B., & Liang, E.-W. 2021, ApJ, 919, 59 [NASA ADS] [CrossRef] [Google Scholar]
- Chen, M.-H., Hu, R.-C., & Liang, E.-W. 2022, ApJ, 932, L7 [NASA ADS] [CrossRef] [Google Scholar]
- Chen, M.-H., Hu, R.-C., & Liang, E.-W. 2023, MNRAS, 520, 2806 [Google Scholar]
- Chen, M.-H., Li, L.-X., Chen, Q.-H., Hu, R.-C., & Liang, E.-W. 2024a, MNRAS, 529, 1154 [Google Scholar]
- Chen, M.-H., Li, L.-X., & Liang, E.-W. 2024b, ApJ, 971, 143 [NASA ADS] [CrossRef] [Google Scholar]
- Cowan, J. J., Sneden, C., Burles, S., et al. 2002, ApJ, 572, 861 [NASA ADS] [CrossRef] [Google Scholar]
- Cowan, J. J., Sneden, C., Lawler, J. E., et al. 2021, Rev. Mod. Phys., 93, 015002 [Google Scholar]
- Cyburt, R. H., Amthor, A. M., Ferguson, R., et al. 2010, ApJS, 189, 240 [NASA ADS] [CrossRef] [Google Scholar]
- Duflo, J., & Zuker, A. P. 1995, Phys. Rev. C, 52, R23 [CrossRef] [PubMed] [Google Scholar]
- Eichler, M., Arcones, A., Kelic, A., et al. 2015, ApJ, 808, 30 [NASA ADS] [CrossRef] [Google Scholar]
- Frebel, A., Christlieb, N., Norris, J. E., et al. 2007, ApJ, 660, L117 [NASA ADS] [CrossRef] [Google Scholar]
- Goriely, S., Hilaire, S., & Koning, A. J. 2008, A&A, 487, 767 [NASA ADS] [CrossRef] [EDP Sciences] [Google Scholar]
- Goriely, S., Chamel, N., & Pearson, J. M. 2009, Phys. Rev. Lett., 102, 152503 [Google Scholar]
- Goriely, S., Chamel, N., & Pearson, J. M. 2013, Phys. Rev. C, 88, 061302 [Google Scholar]
- Hao, Y. W., Niu, Y. F., & Niu, Z. M. 2023, Phys. Lett. B, 844, 138092 [Google Scholar]
- Hill, V., Plez, B., Cayrel, R., et al. 2002, A&A, 387, 560 [CrossRef] [EDP Sciences] [Google Scholar]
- Hill, V., Christlieb, N., Beers, T. C., et al. 2017, A&A, 607, A91 [NASA ADS] [CrossRef] [EDP Sciences] [Google Scholar]
- Holmbeck, E. M., Beers, T. C., Roederer, I. U., et al. 2018, ApJ, 859, L24 [NASA ADS] [CrossRef] [Google Scholar]
- Horowitz, C. J., Arcones, A., Côté, B., et al. 2019, J. Phys. G Nucl. Phys., 46, 083001 [NASA ADS] [CrossRef] [Google Scholar]
- Hotokezaka, K., Wanajo, S., Tanaka, M., et al. 2016, MNRAS, 459, 35 [Google Scholar]
- Hotokezaka, K., Beniamini, P., & Piran, T. 2018, Int. J. Mod. Phys. D, 27, 1842005 [Google Scholar]
- Kajino, T., Aoki, W., Balantekin, A. B., et al. 2019, Prog. Part. Nucl. Phys., 107, 109 [NASA ADS] [CrossRef] [Google Scholar]
- Kasen, D., Metzger, B., Barnes, J., Quataert, E., & Ramirez-Ruiz, E. 2017, Nature, 551, 80 [Google Scholar]
- Kodama, T., & Takahashi, K. 1975, Nucl. Phys. A, 239, 489 [Google Scholar]
- Kondev, F. G., Wang, M., Huang, W. J., Naimi, S., & Audi, G. 2021, Chin. Phys. C, 45, 030001 [NASA ADS] [CrossRef] [Google Scholar]
- Lattimer, J. M., & Schramm, D. N. 1974, ApJ, 192, L145 [NASA ADS] [CrossRef] [Google Scholar]
- Levan, A. J., Gompertz, B. P., Salafia, O. S., et al. 2024, Nature, 626, 737 [NASA ADS] [CrossRef] [Google Scholar]
- Li, L.-X. 2019, ApJ, 872, 19 [NASA ADS] [CrossRef] [Google Scholar]
- Li, L.-X., & Paczyński, B. 1998, ApJ, 507, L59 [NASA ADS] [CrossRef] [Google Scholar]
- Lippuner, J., & Roberts, L. F. 2015, ApJ, 815, 82 [CrossRef] [Google Scholar]
- Lippuner, J., & Roberts, L. F. 2017, ApJS, 233, 18 [NASA ADS] [CrossRef] [Google Scholar]
- Mendoza-Temis, J. D. J., Wu, M.-R., Langanke, K., et al. 2015, Phys. Rev. C, 92, 055805 [CrossRef] [Google Scholar]
- Metzger, B. D., Martínez-Pinedo, G., Darbha, S., et al. 2010, MNRAS, 406, 2650 [NASA ADS] [CrossRef] [Google Scholar]
- Möller, P., Nix, J. R., Myers, W. D., & Swiatecki, W. J. 1995, Atomic Data Nucl. Data Tables, 59, 185 [CrossRef] [Google Scholar]
- Möller, P., Myers, W. D., Sagawa, H., & Yoshida, S. 2012, Phys. Rev. Lett., 108, 052501 [Google Scholar]
- Möller, P., Sierk, A. J., Ichikawa, T., Iwamoto, A., & Mumpower, M. 2015, Phys. Rev. C, 91, 024310 [CrossRef] [Google Scholar]
- Möller, P., Sierk, A. J., Ichikawa, T., & Sagawa, H. 2016, Atomic Data Nucl. Data Tables, 109, 1 [CrossRef] [Google Scholar]
- Mumpower, M. R., McLaughlin, G. C., & Surman, R. 2012, Phys. Rev. C, 86, 035803 [Google Scholar]
- Mumpower, M. R., Surman, R., Fang, D. L., et al. 2015, Phys. Rev. C, 92, 035807 [Google Scholar]
- Mumpower, M. R., Surman, R., McLaughlin, G. C., & Aprahamian, A. 2016, Prog. Part. Nucl. Phys., 86, 86 [CrossRef] [Google Scholar]
- Nedora, V., Bernuzzi, S., Radice, D., et al. 2021, ApJ, 906, 98 [NASA ADS] [CrossRef] [Google Scholar]
- Niu, Z., Sun, B., & Meng, J. 2009, Phys. Rev. C, 80, 065806 [Google Scholar]
- Placco, V. M., Holmbeck, E. M., Frebel, A., et al. 2017, ApJ, 844, 18 [NASA ADS] [CrossRef] [Google Scholar]
- Radice, D., Perego, A., Hotokezaka, K., et al. 2018, ApJ, 869, 130 [Google Scholar]
- Roederer, I. U., Beers, T. C., Hattori, K., et al. 2024, ApJ, 971, 158 [NASA ADS] [CrossRef] [Google Scholar]
- Sneden, C., Cowan, J. J., & Gallino, R. 2008, ARA&A, 46, 241 [Google Scholar]
- Surman, R., & Engel, J. 2001, Phys. Rev. C, 64, 035801 [Google Scholar]
- Symbalisty, E., & Schramm, D. N. 1982, Astrophys. Lett., 22, 143 [NASA ADS] [Google Scholar]
- Vassh, N., Wang, X., Larivière, M., et al. 2024, Phys. Rev. Lett., 132, 052701 [Google Scholar]
- Wang, N., Liang, Z., Liu, M., & Wu, X. 2010, Phys. Rev. C, 82, 044304 [Google Scholar]
- Wang, N., Liu, M., Wu, X., & Meng, J. 2014, Phys. Lett. B, 734, 215 [Google Scholar]
- Wang, M., Audi, G., Kondev, F. G., et al. 2017, Chin. Phys. C, 41, 030003 [NASA ADS] [CrossRef] [Google Scholar]
- Wang, X., et al. (N3AS Collaboration) 2020, ApJ, 903, L3 [CrossRef] [Google Scholar]
- Wang, M., Huang, W. J., Kondev, F. G., Audi, G., & Naimi, S. 2021, Chin. Phys. C, 45, 030003 [CrossRef] [Google Scholar]
- Watson, D., Hansen, C. J., Selsing, J., et al. 2019, Nature, 574, 497 [NASA ADS] [CrossRef] [Google Scholar]
- Wu, X. H., Zhao, P. W., Zhang, S. Q., & Meng, J. 2022, ApJ, 941, 152 [NASA ADS] [CrossRef] [Google Scholar]
- Yong, D., Kobayashi, C., Da Costa, G. S., et al. 2021, Nature, 595, 223 [CrossRef] [PubMed] [Google Scholar]
- Zhu, Y. L., Lund, K. A., Barnes, J., et al. 2021, ApJ, 906, 94 [CrossRef] [Google Scholar]
All Tables
Comparison of the rms deviations between theoretical values from nuclear physics models and experimental data in the AME2020 database.
Comparison of the rms deviations between simulated abundances from various nuclear physics models and observed abundances in r-process-enhanced metal-poor stars.
All Figures
|
Fig. 1. Comparison of typical features of the r-process path with the latest measured nuclei from the AME2020 database. The abundance distribution corresponds to the early stages of r-process nucleosynthesis at t = 0.2 s, when the neutron capture process has begun. Our nucleosynthesis calculations started when the temperature dropped below T = 6 × 10⁹ K. The astrophysical parameters are typical for binary neutron star mergers: The electron fraction Ye = 0.10, the specific entropy s = 10 kB/baryon, and the expansion timescale τ = 10 ms. The horizontal and vertical black lines indicate closed proton and neutron shell nuclei, respectively. |
| In the text | |
|
Fig. 2. Deviations between theoretical values from nuclear mass models and experimental values in the AME2020 database. Four widely used nuclear mass models are considered: FRDM2012, HFB27, DZ31, and WS4. The solid circles represent newly measured nuclei that are included in the AME2020, but not in the previous AME2016. |
| In the text | |
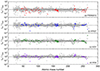 |
Fig. 3. Same as Fig. 2, but showing deviations for neutron-capture rates at a temperature of 109 K. |
| In the text | |
|
Fig. 4. Comparison of the neutron-capture rates for each nucleus calculated using various nuclear physics models. |
| In the text | |
|
Fig. 5. Deviations between the neutron-capture rates obtained using the fitted polynomial format and those calculated with the TALYS code. The neutron-capture rates are shown at temperatures of 1 × 10⁹ K (top panel) and 6 × 10⁹ K (bottom panel). The nuclear mass values are based on the WS4 model. |
| In the text | |
|
Fig. 6. Abundance patterns of r-process elements produced by neutron star mergers at t = 109 s. The solar r-process abundances from Arnould et al. (2007) are shown for comparison. The astrophysical parameters used in the simulations are detailed in Table 2. |
| In the text | |
|
Fig. 7. Comparison of the r-process abundances from neutron star mergers with those observed in r-process-enhanced metal-poor stars. Eight r-process-enhanced metal-poor stars are considered: CS 31082–001 (Hill et al. 2002), BD +17°3248 (Cowan et al. 2002), HE 1523–0901 (Frebel et al. 2007), CS 29497–004 (Hill et al. 2017), J2038–0023 (Placco et al. 2017), J0954+5246 (Holmbeck et al. 2018), J2003–1142 (Yong et al. 2021), and J2213–5137 (Roederer et al. 2024). The element abundances of these stars are scaled to Y(Z = 63) = 5.0 × 10⁻⁵. The blue lines represent the average abundances across the astrophysical models for neutron star mergers. |
| In the text | |
Current usage metrics show cumulative count of Article Views (full-text article views including HTML views, PDF and ePub downloads, according to the available data) and Abstracts Views on Vision4Press platform.
Data correspond to usage on the plateform after 2015. The current usage metrics is available 48-96 hours after online publication and is updated daily on week days.
Initial download of the metrics may take a while.