Fig. 4
Download original image
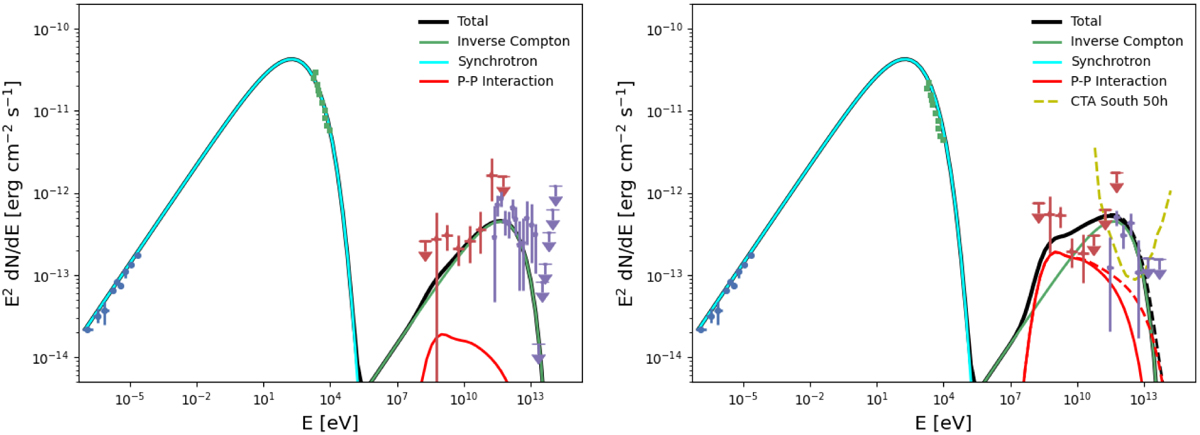
Spectral energy modelling of the NE (left) and SW (right) regions of SN 1006. For all experiments except Fermi, only statistical errors are shown. Modelling parameters are listed in Table 4. The cyan and green lines represent the synchrotron emission and the IC emission, respectively. The black and red dotted lines represent the total and pion decay emission derived for a proton energy cut-off at 200 TeV while the solid ones are derived for 20 TeV. The dashed yellow line indicates the sensitivity of CTA for 50 hours of observation (latest response function: Southern array Prod 5). The blue radio (Allen et al. 2001) and green X-ray (Bamba et al. 2008) data from the whole SNR have been scaled for each limb (see Section 5 for more details). The H.E.S.S. spectral points for each limb (Acero et al. 2010) are indicated in purple. The data points derived in this analysis for the NE and SW limbs are presented in red.
Current usage metrics show cumulative count of Article Views (full-text article views including HTML views, PDF and ePub downloads, according to the available data) and Abstracts Views on Vision4Press platform.
Data correspond to usage on the plateform after 2015. The current usage metrics is available 48-96 hours after online publication and is updated daily on week days.
Initial download of the metrics may take a while.