Fig. 3
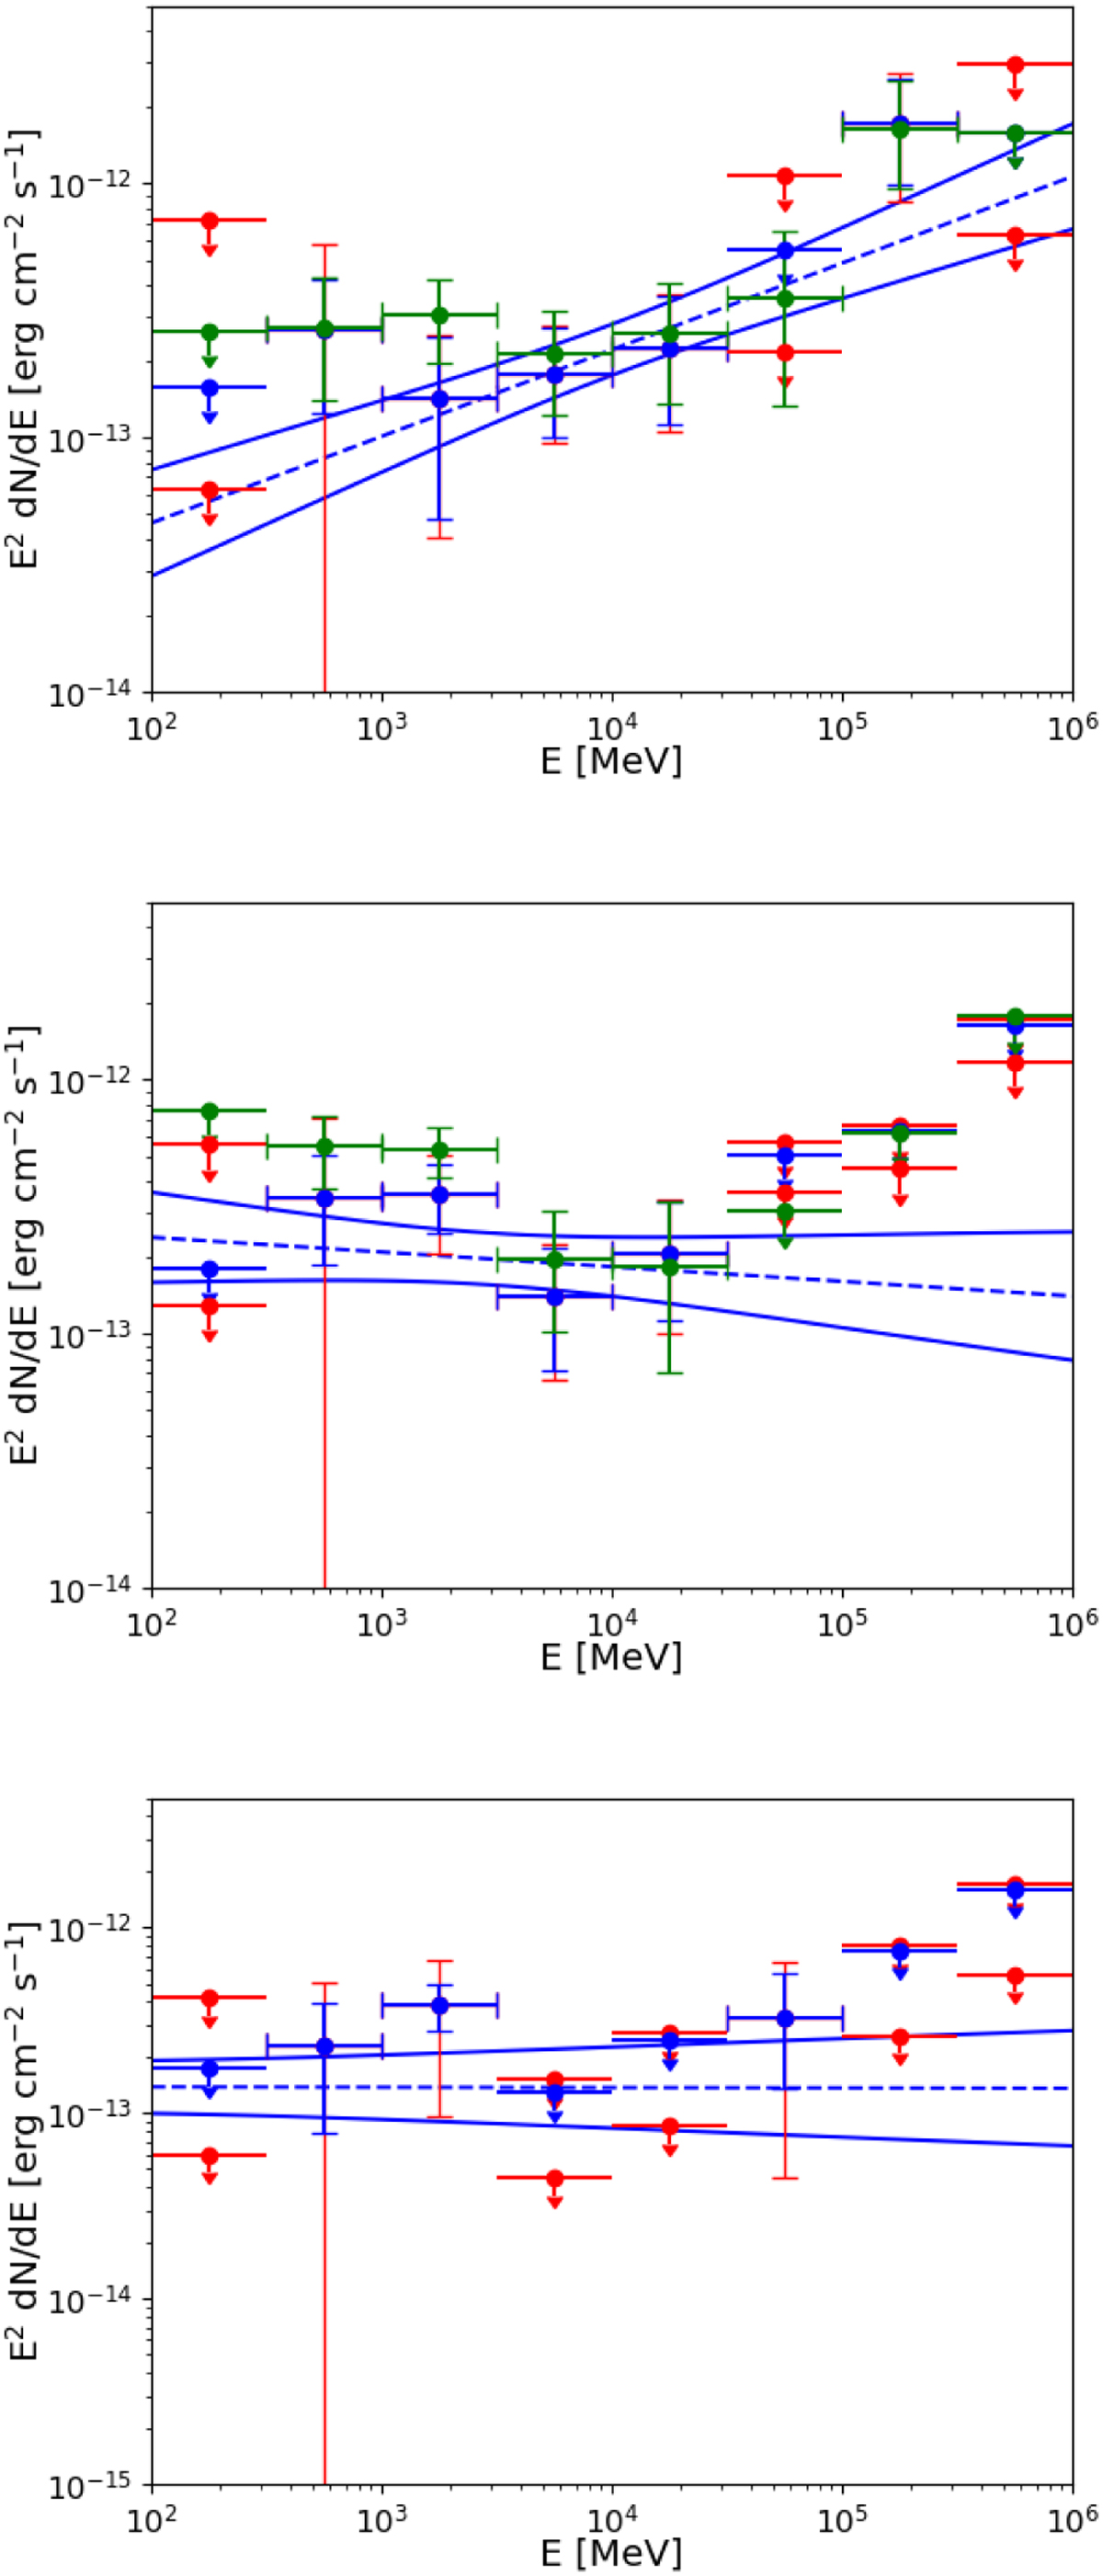
Download original image
Fermi-LAT SED of the three components included in the best spatial model (Model 6): the H.E.S.S. Top panel: NE limb. Middle panel: point source coincident with the SW limb. Bottom panel: Hα component. For all SEDs, blue error bars represent the statistical uncertainties, while the red ones correspond to the statistical and systematic uncertainties added in quadrature. For upper limits, the two red arrows indicate the extrema of upper limits obtained with the different systematics. The solid and dashed blue lines represent the best spectral fit and its 68% confidence band. For the NE and SW components, the green spectral points indicate the spectra derived for Model 8 using the two radio halves (only statistical errors are presented for better visibility; systematic uncertainties for this model are indicated in Table 3).
Current usage metrics show cumulative count of Article Views (full-text article views including HTML views, PDF and ePub downloads, according to the available data) and Abstracts Views on Vision4Press platform.
Data correspond to usage on the plateform after 2015. The current usage metrics is available 48-96 hours after online publication and is updated daily on week days.
Initial download of the metrics may take a while.