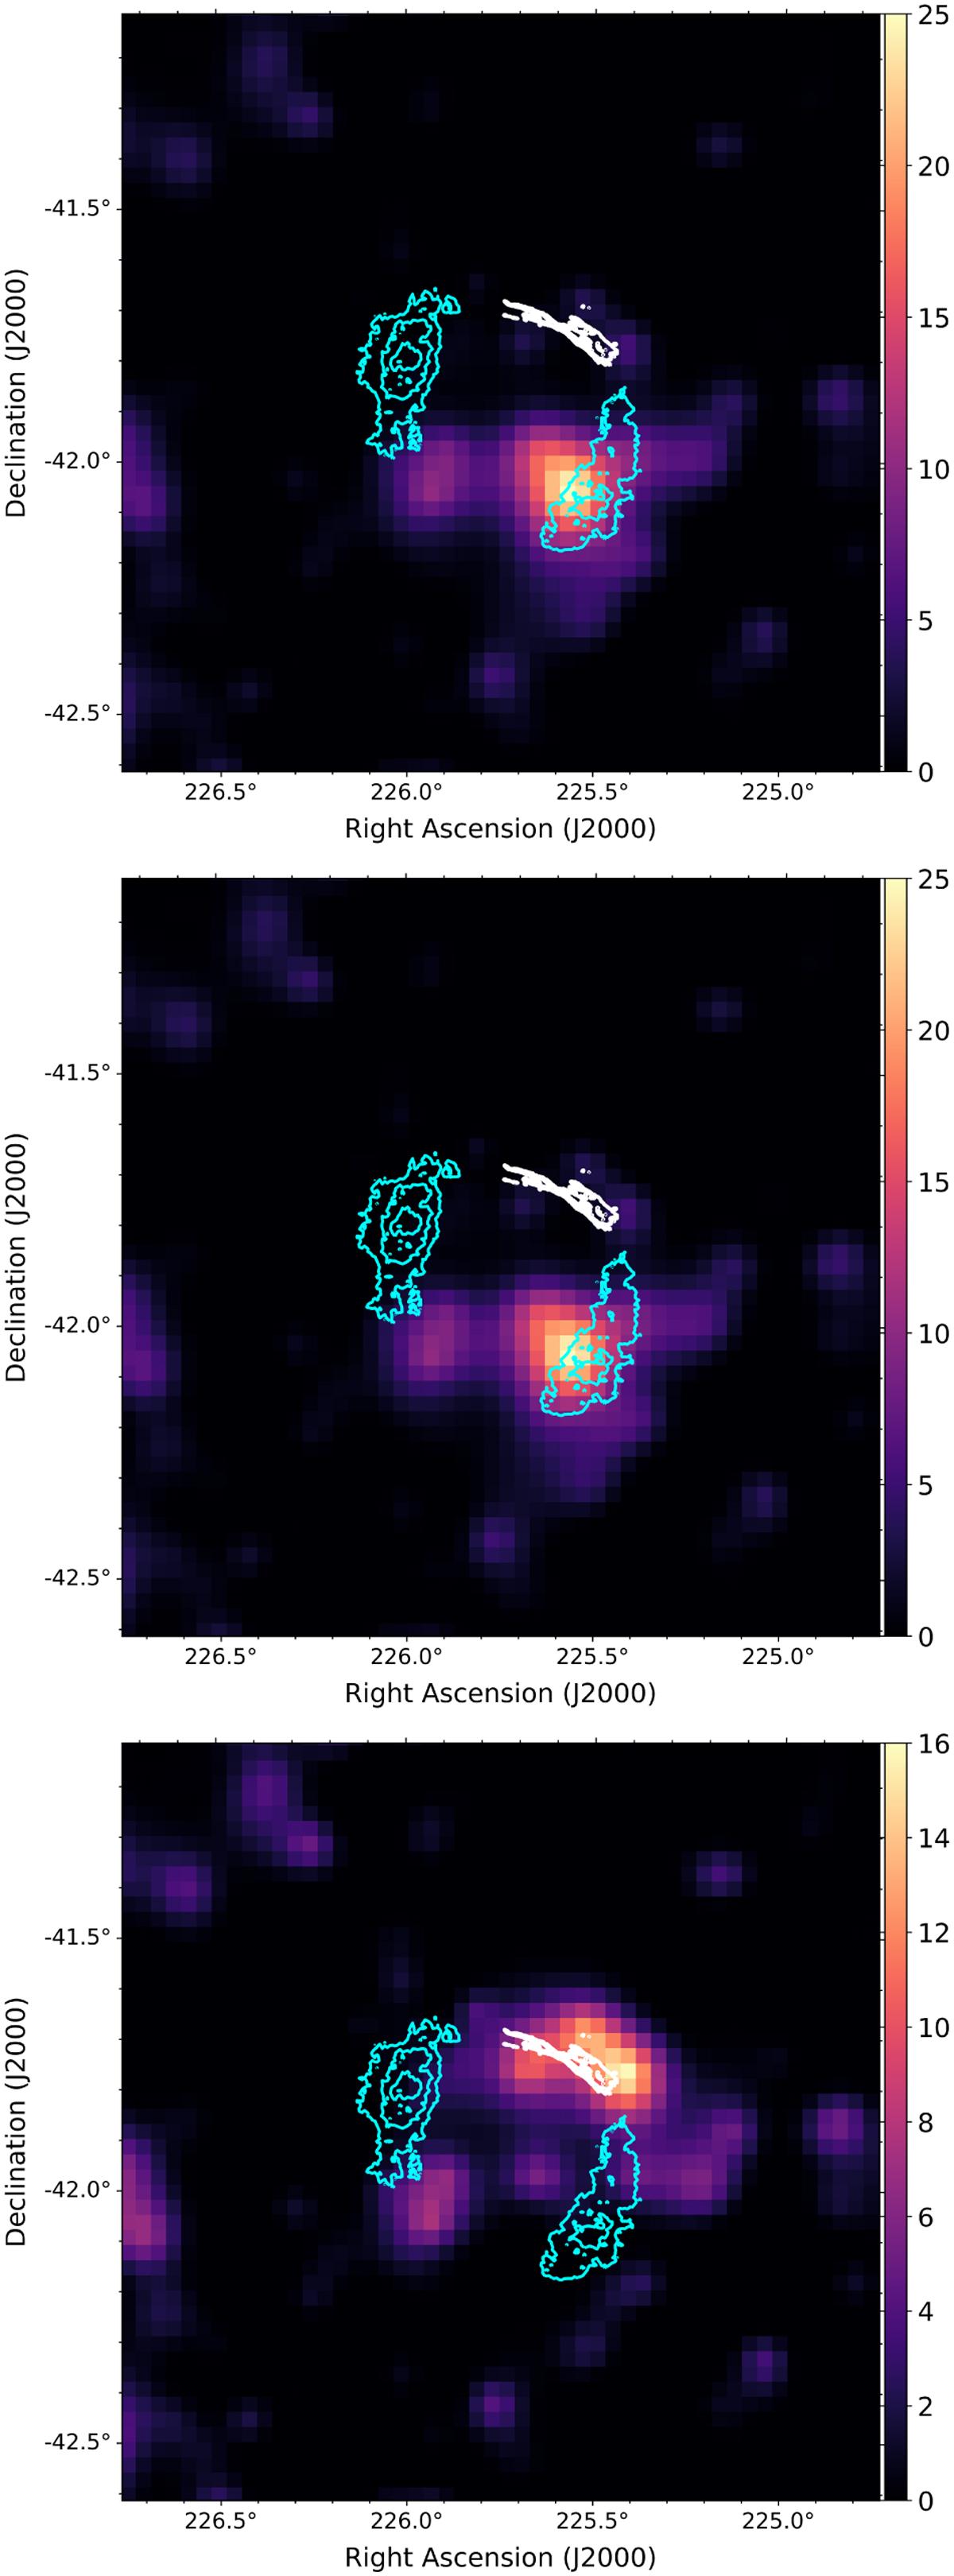
Fig. 2
Download original image
Fermi-LAT TS map above 1 GeV after removing one of the three components from the best spatial model (Model 6, see Table 1): the H.E.S.S. NE limb (top panel), the Point source in the SW (middle panel), and the Hα component (bottom panel) with a reduced colour scale. For all TS maps, we present the 1.5° × 1.5° ROI around SN 1006. The cyan contours represent the H.E.S.S. significance contours at 3, 5, and 7σ (Acero et al. 2010). White contours show the Hα template used in our analysis.
Current usage metrics show cumulative count of Article Views (full-text article views including HTML views, PDF and ePub downloads, according to the available data) and Abstracts Views on Vision4Press platform.
Data correspond to usage on the plateform after 2015. The current usage metrics is available 48-96 hours after online publication and is updated daily on week days.
Initial download of the metrics may take a while.