Fig. 1
Download original image
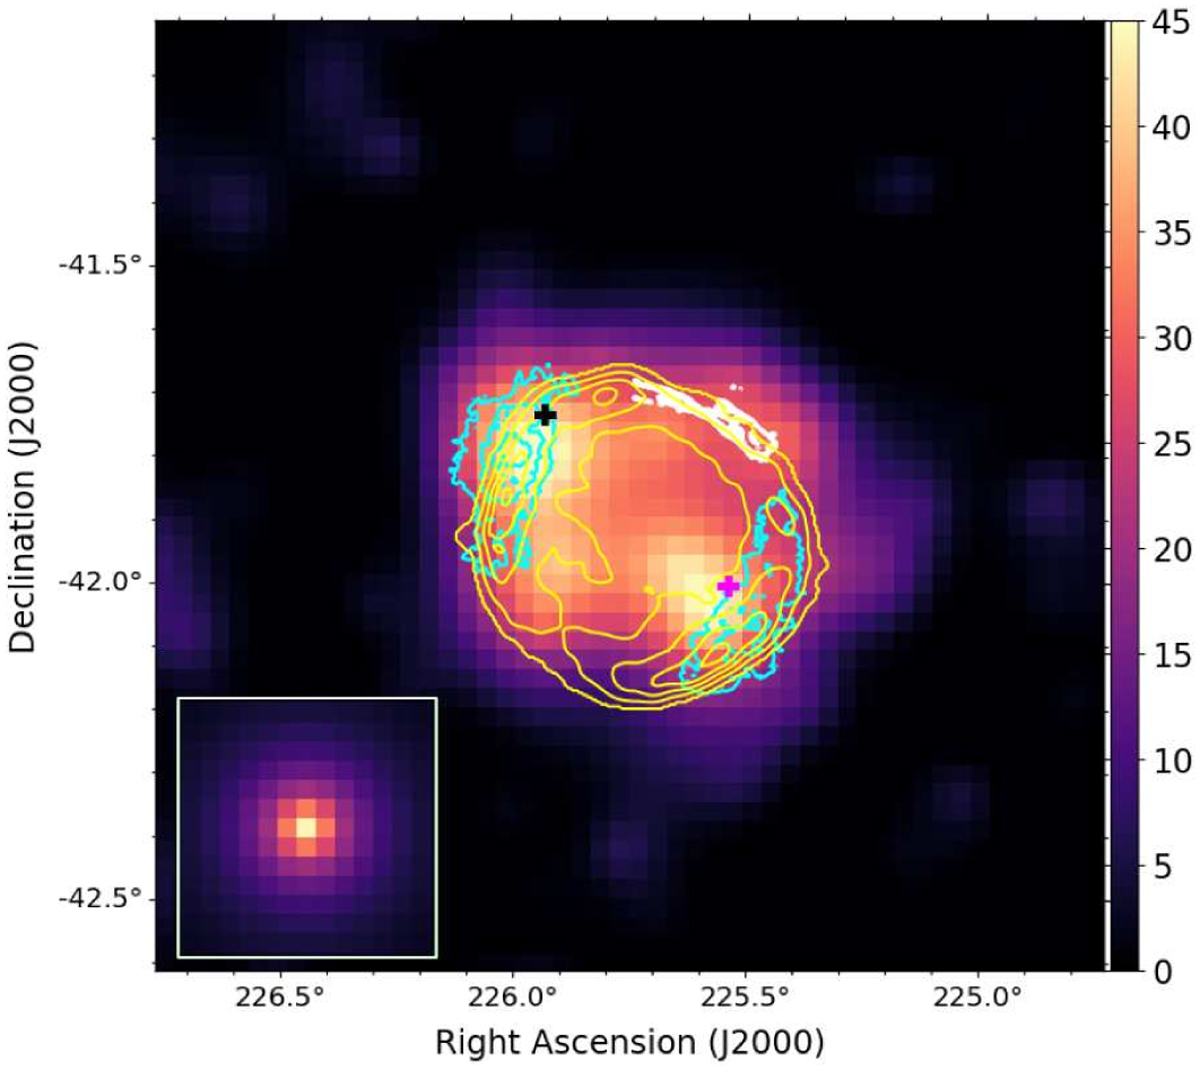
Fermi-LAT TS map above 1 GeV for the 1.5° × 1.5° region around the SNR SN 1006. The black cross indicates the only 4FGL- DR4 source in the region (4FGL J1503.6–4146), while the magenta cross indicates the point source coincident with the SW rim added in our best model. The cyan contours represent the H.E.S.S. significance contours at 3, 5, and 7σ (Acero et al. 2010). White contours show the Hα template generated from the 4m Blanco telescope observations at CTIO (Winkler et al. 2014). Yellow contours present the radio spatial template derived using observations from the Murchison Widefield Array (Hurley-Walker et al. 2017). The inset on the bottom left corner provides the counts map from a simulated point source in the same coordinate system (more details in Appendix A).
Current usage metrics show cumulative count of Article Views (full-text article views including HTML views, PDF and ePub downloads, according to the available data) and Abstracts Views on Vision4Press platform.
Data correspond to usage on the plateform after 2015. The current usage metrics is available 48-96 hours after online publication and is updated daily on week days.
Initial download of the metrics may take a while.