Fig. 6.
Download original image
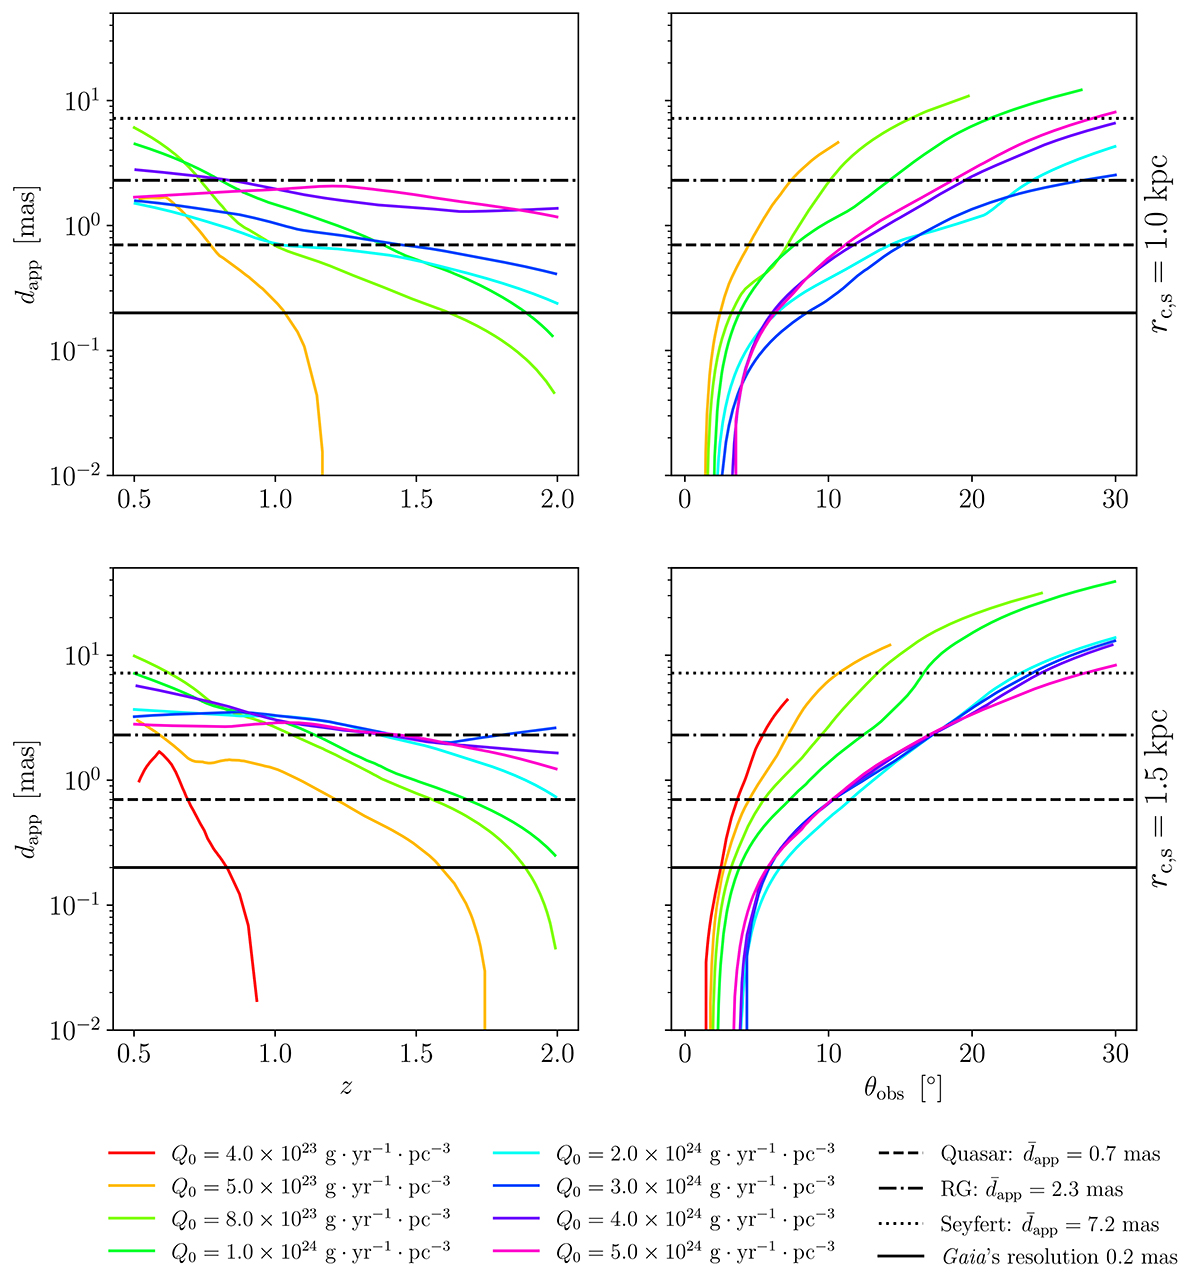
Dependence of the apparent radio–optical offset dapp on the redshift z (left column) and jet observation angle θobs (right column). For various average mass-loading rates Q0 (see legend), solid lines represent the average across our randomized set of jets. Results are displayed for the two stellar distributions tested (rc,s = 1.0 kpc first row and rc,s = 1.5 kpc second row), with a fixed gas distribution of r_{\mathrm{c}} = 1.0 kpc. The horizontal black lines illustrate the medians dapp obtained by P19 for quasars (0.7 mas, dashed line), radio galaxies (2.3 mas, dash dotted line), and Seyfert 2 (7.2 mas, dotted line) in the case of significant offset detection. We also show the typical Gaia angular resolution as a solid black line for qualitative comparisons.
Current usage metrics show cumulative count of Article Views (full-text article views including HTML views, PDF and ePub downloads, according to the available data) and Abstracts Views on Vision4Press platform.
Data correspond to usage on the plateform after 2015. The current usage metrics is available 48-96 hours after online publication and is updated daily on week days.
Initial download of the metrics may take a while.