Fig. 5.
Download original image
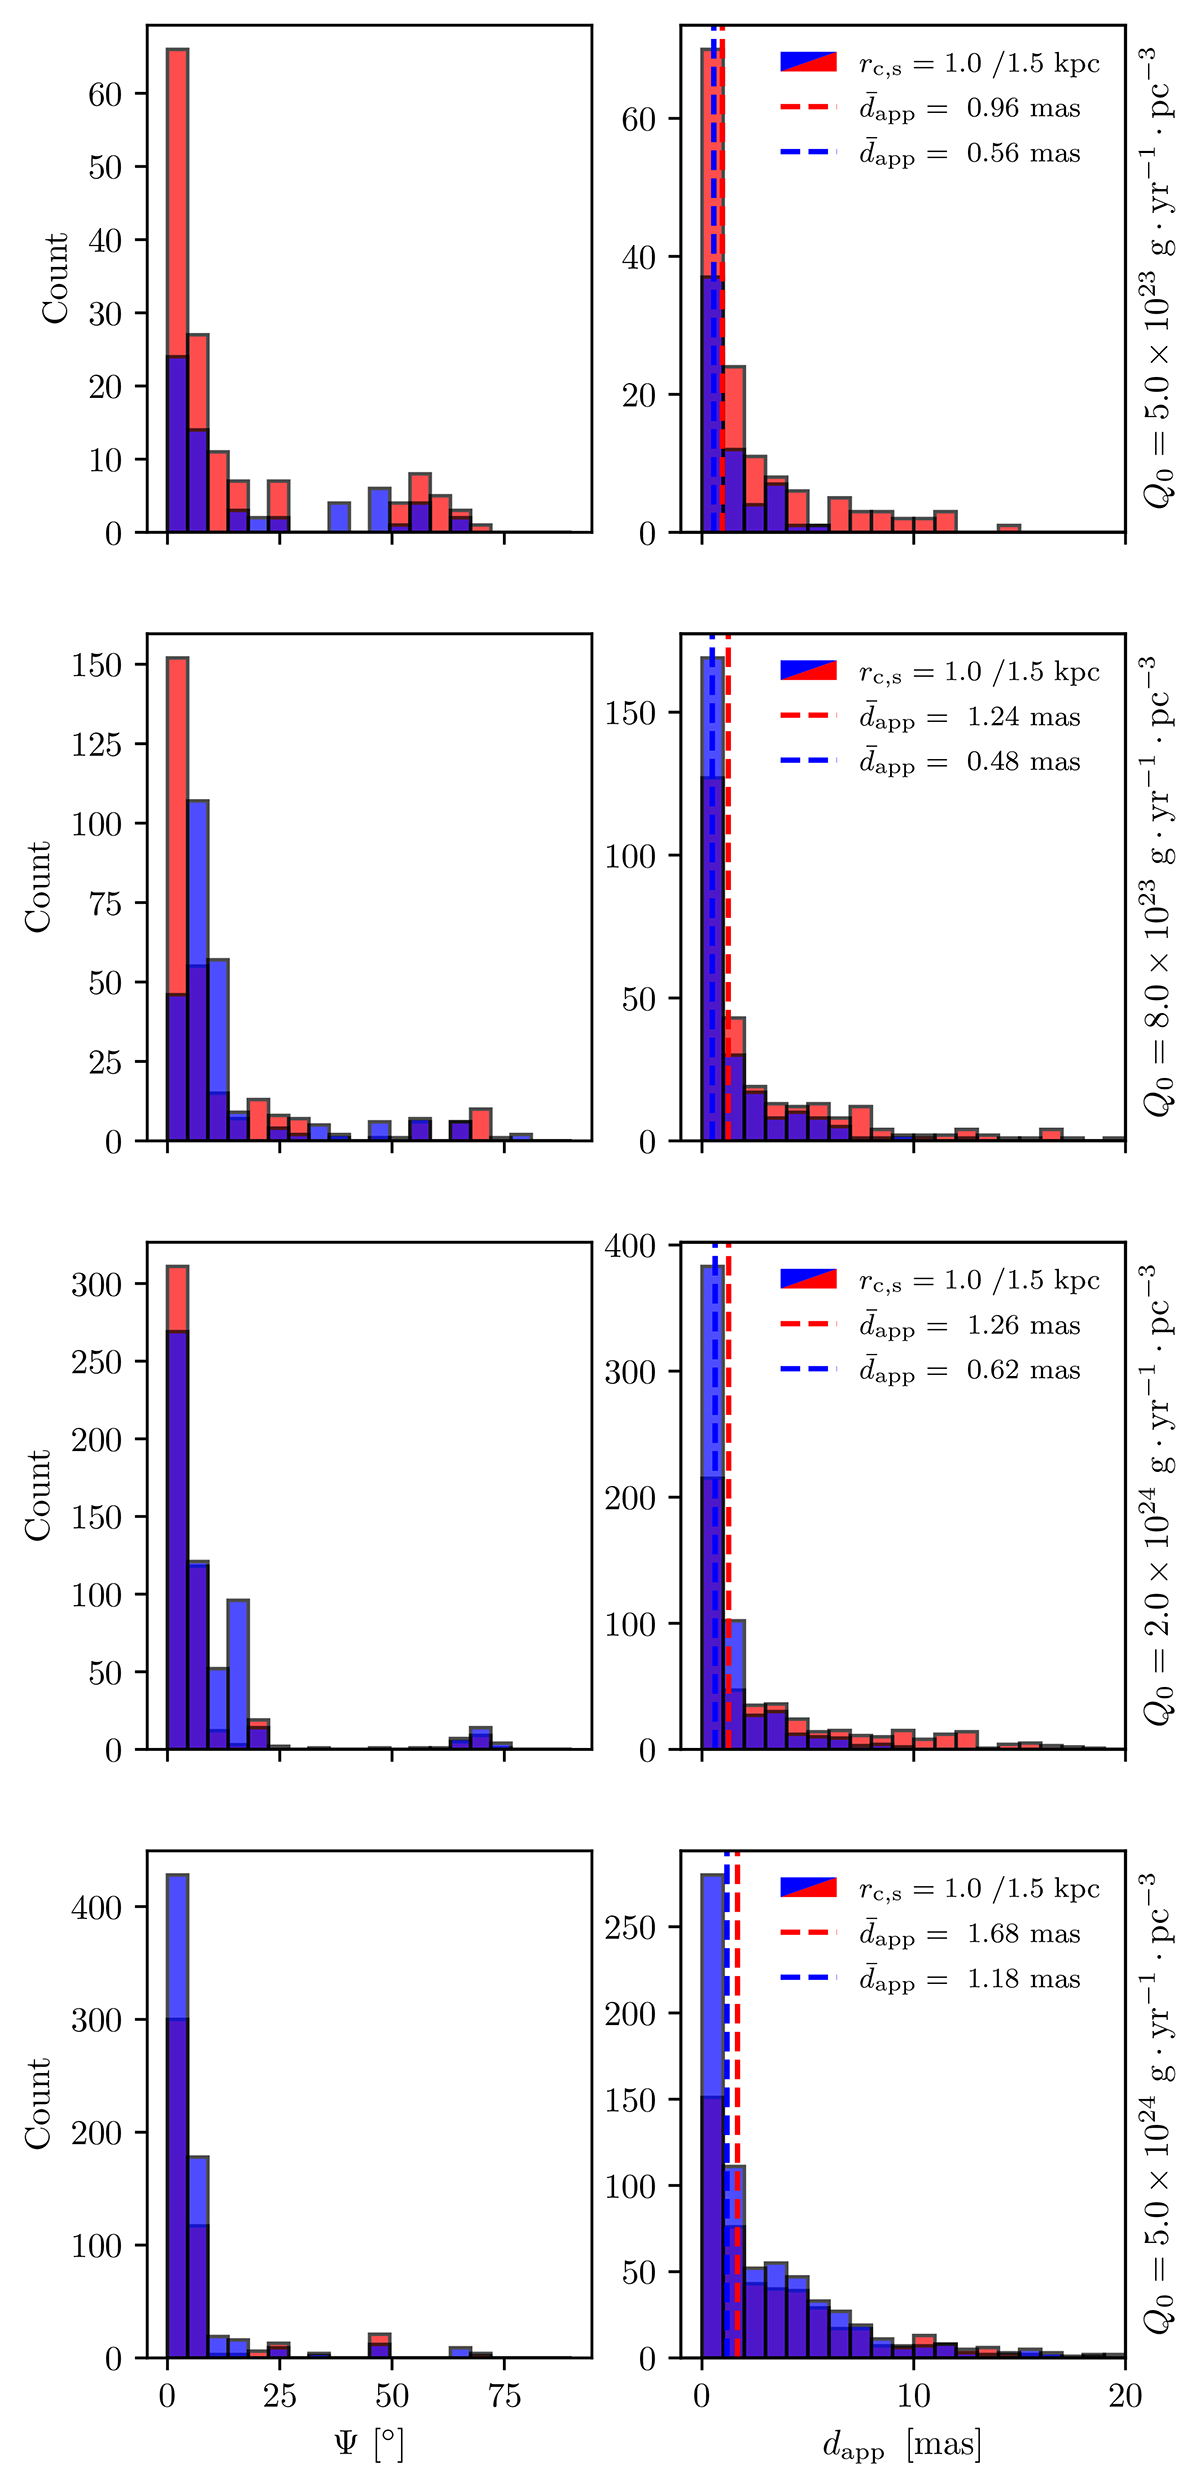
Histograms of the radio–optical angle (Ψ, left) and apparent offset (dapp, right) for the set of randomized synthetic emission maps. Each row represents histograms for a given average mass-loading Q0 and for a given star distribution (rc,s= 1.0 kpc in blue and rc,s = 1.5 kpc in red; dark blue represents the overlap). Vertical dashed lines in the panels of the right column represent the associated median radio–optical offset.
Current usage metrics show cumulative count of Article Views (full-text article views including HTML views, PDF and ePub downloads, according to the available data) and Abstracts Views on Vision4Press platform.
Data correspond to usage on the plateform after 2015. The current usage metrics is available 48-96 hours after online publication and is updated daily on week days.
Initial download of the metrics may take a while.