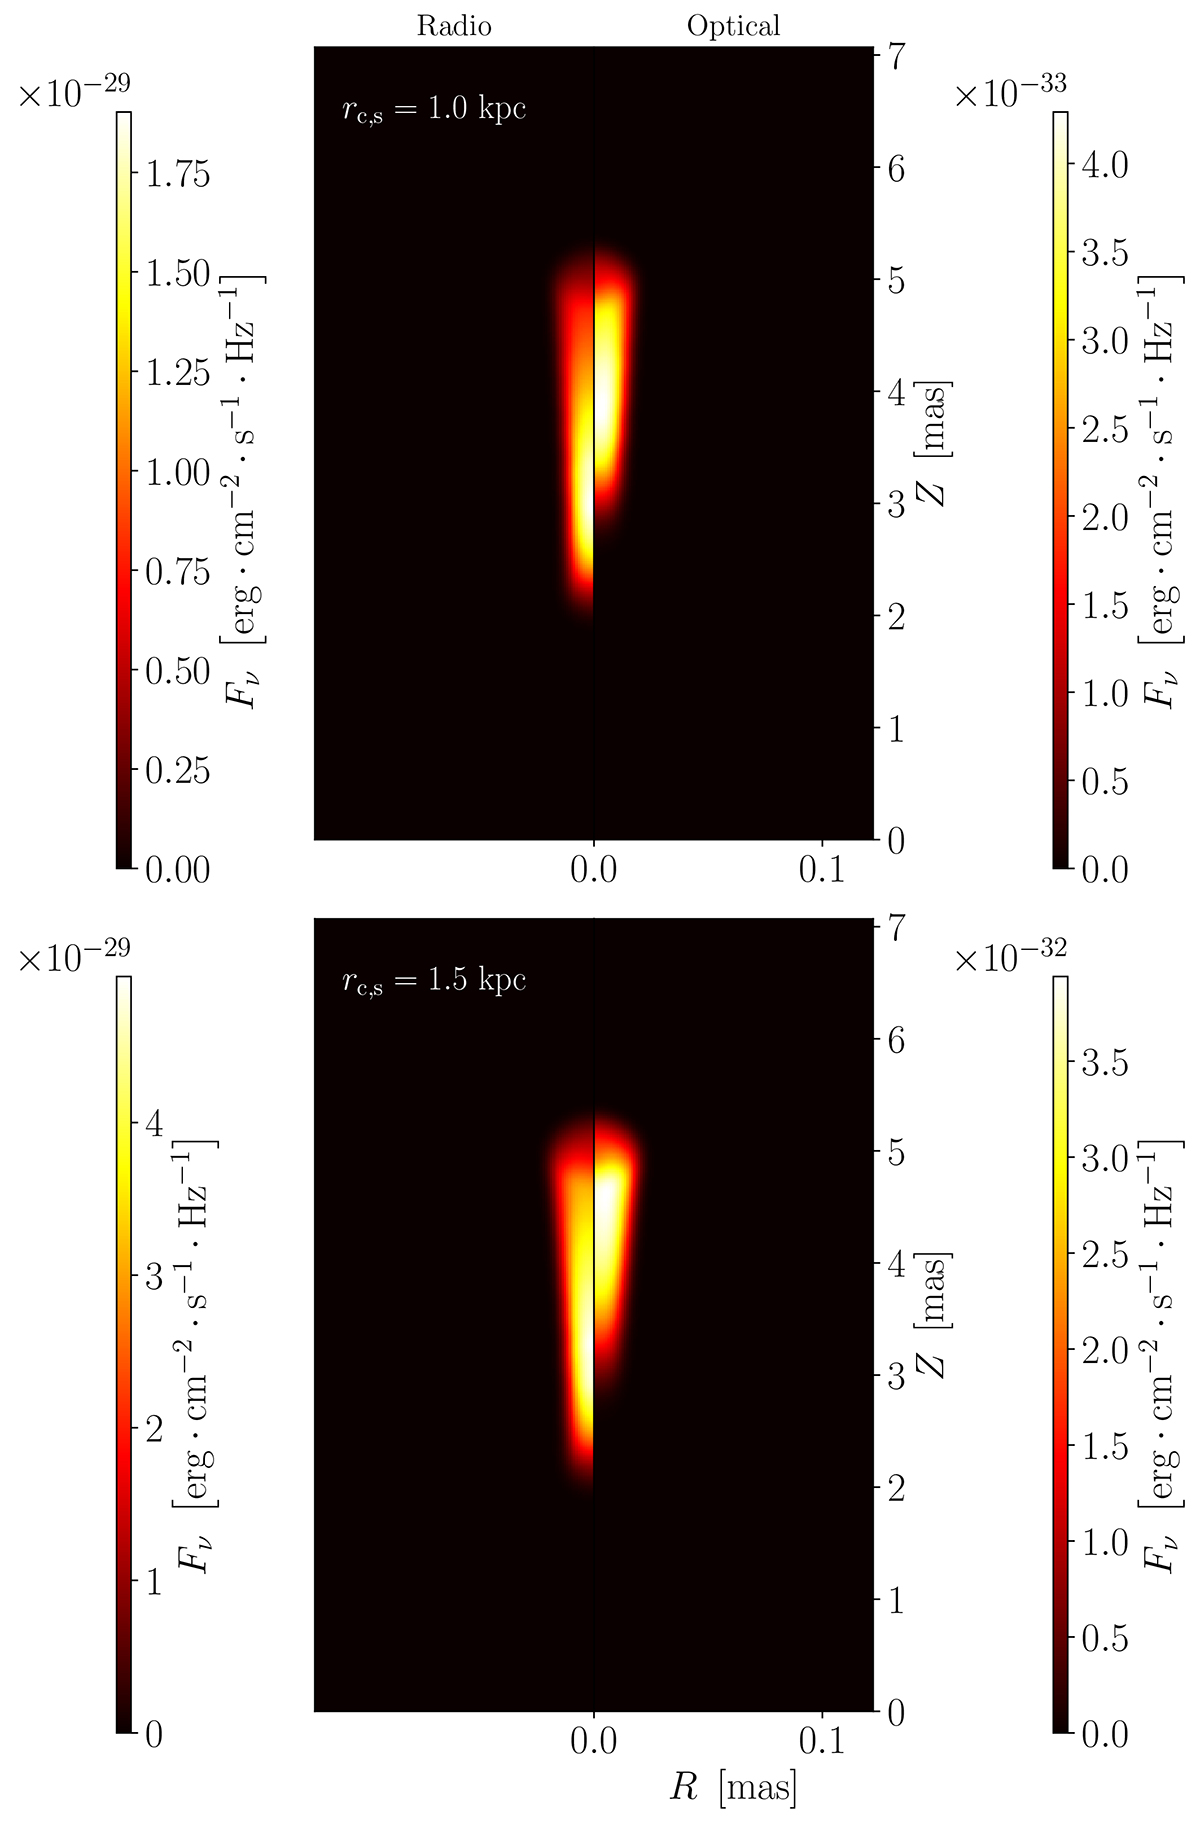
Fig. 3.
Download original image
Synthetic synchrotron flux maps in the radio (ν = 3 × 10¹¹ Hz, left) and in the optical band (ν = 5 × 10¹⁴ Hz, right) from simulations shown in Figure 1. We display the results for the two stellar distributions rc,s = 1.0 kpc (up) and rc,s= 1.5 kpc (down) for a viewing angle θobs = 10°, a redshift z = 1.4, a fixed ![]() and a fixed average mass load of Q0 = 5 × 10²³ g · yr−1 · pc−3.
and a fixed average mass load of Q0 = 5 × 10²³ g · yr−1 · pc−3.
Current usage metrics show cumulative count of Article Views (full-text article views including HTML views, PDF and ePub downloads, according to the available data) and Abstracts Views on Vision4Press platform.
Data correspond to usage on the plateform after 2015. The current usage metrics is available 48-96 hours after online publication and is updated daily on week days.
Initial download of the metrics may take a while.