Fig. 12.
Download original image
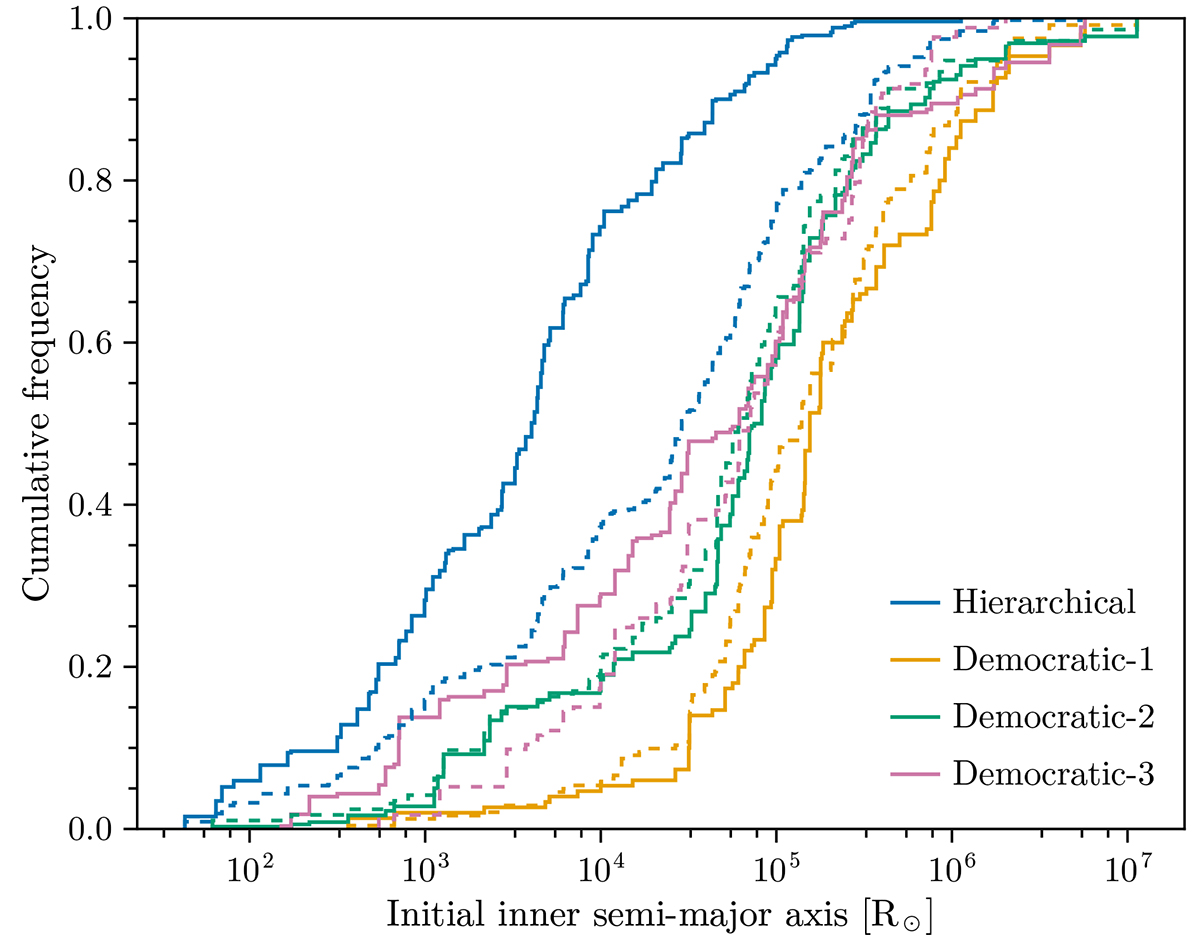
For the systems that eject one of the components, what are the distributions of the initial inner semi-major axis? This figure shows the cumulative frequency of this quantity for both the N-body model (solid) and the SE model (dashed). The different colours indicate whether the democratic flag was raised during the simulation, and which body was ejected. In the case of hierarchical ejection (blue lines), the tertiary was ejected without the democratic flag being raised, while the other colours indicate that the primary (yellow), secondary (green), or tertiary (black) was ejected after the flag was raised.
Current usage metrics show cumulative count of Article Views (full-text article views including HTML views, PDF and ePub downloads, according to the available data) and Abstracts Views on Vision4Press platform.
Data correspond to usage on the plateform after 2015. The current usage metrics is available 48-96 hours after online publication and is updated daily on week days.
Initial download of the metrics may take a while.