Fig. 6.
Download original image
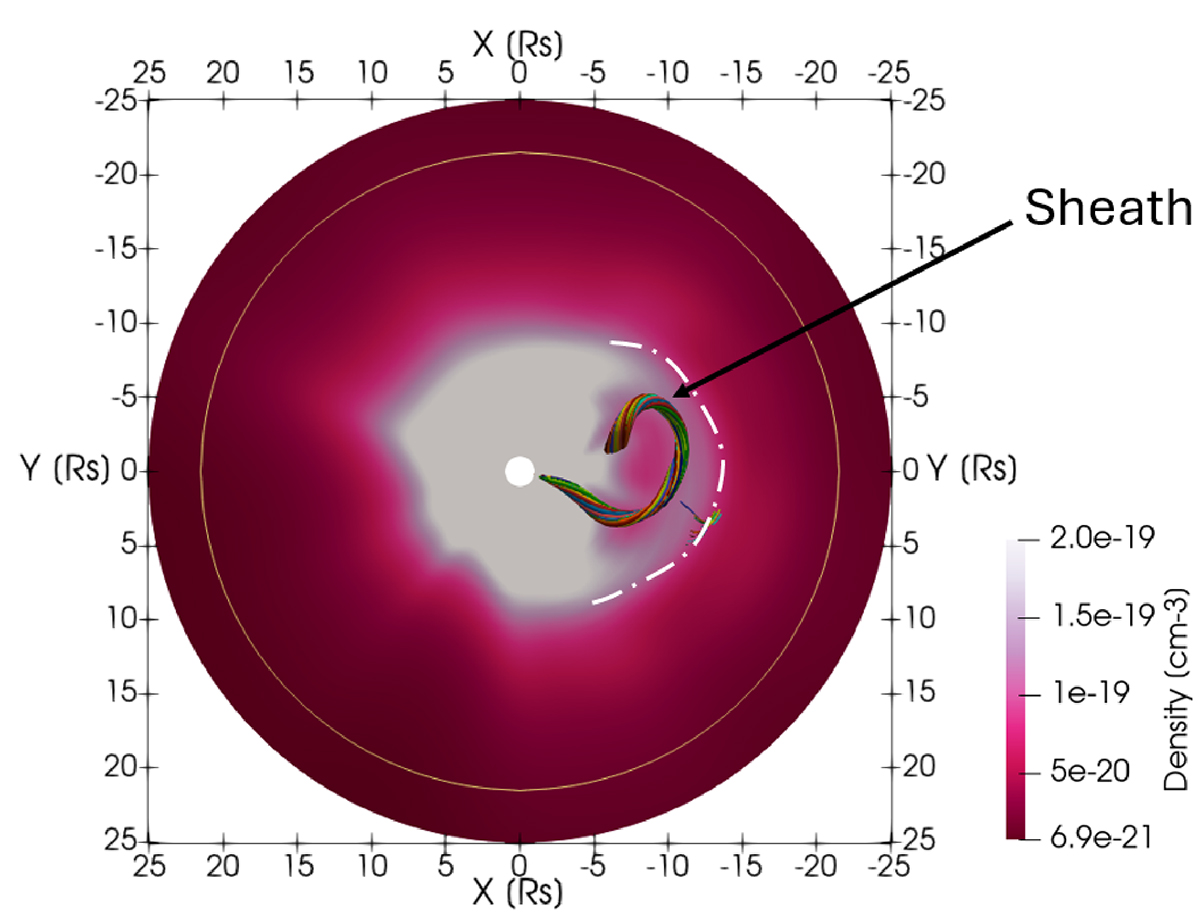
Cross-sections along the equatorial plane of the density for the COCONUT simulation with the TDm flux rope named ‘TDm_3’. The coloured lines represent a sample of the magnetic field lines of the flux rope. The yellow line indicates the Rb = 21.5 R⊙ boundary. A sheath characterised by high density develops ahead of the flux rope during propagation.
Current usage metrics show cumulative count of Article Views (full-text article views including HTML views, PDF and ePub downloads, according to the available data) and Abstracts Views on Vision4Press platform.
Data correspond to usage on the plateform after 2015. The current usage metrics is available 48-96 hours after online publication and is updated daily on week days.
Initial download of the metrics may take a while.