Fig. 5.
Download original image
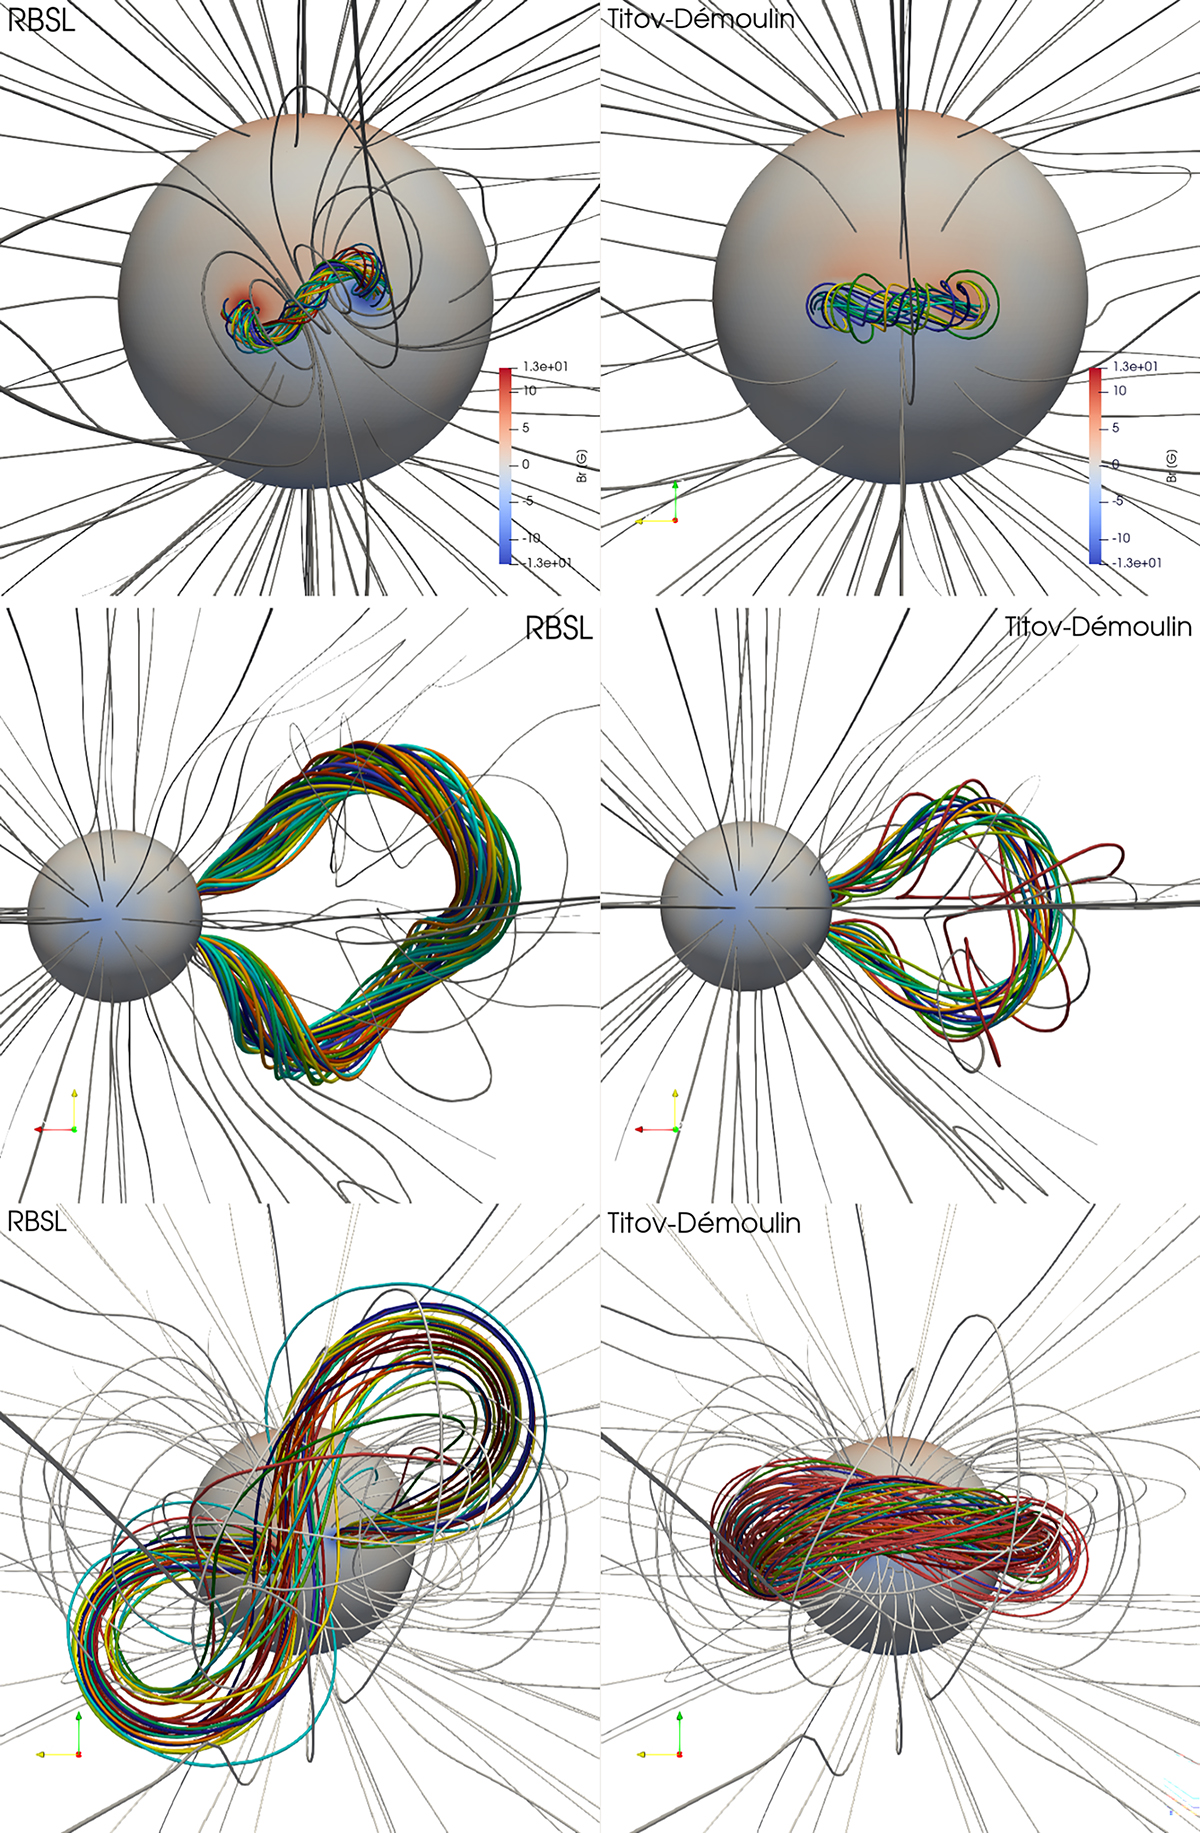
Visualisation of the TDm and RBSL models implemented in COCONUT. The upper panels show the CME models just after their insertion in the solar wind, while the other panels show their expansion 52.8 min after the simulation starts in the top and side views. The coloured lines represent a sample of magnetic field lines from the flux ropes. The origin for tracing these field lines is a sphere with a radius of R = 0.1 R⊙, positioned at the positive polarity. The grey field lines represent the magnetic field from the background solar wind. The radial magnetic field at the solar surface (measured in Gauss) is also displayed.
Current usage metrics show cumulative count of Article Views (full-text article views including HTML views, PDF and ePub downloads, according to the available data) and Abstracts Views on Vision4Press platform.
Data correspond to usage on the plateform after 2015. The current usage metrics is available 48-96 hours after online publication and is updated daily on week days.
Initial download of the metrics may take a while.