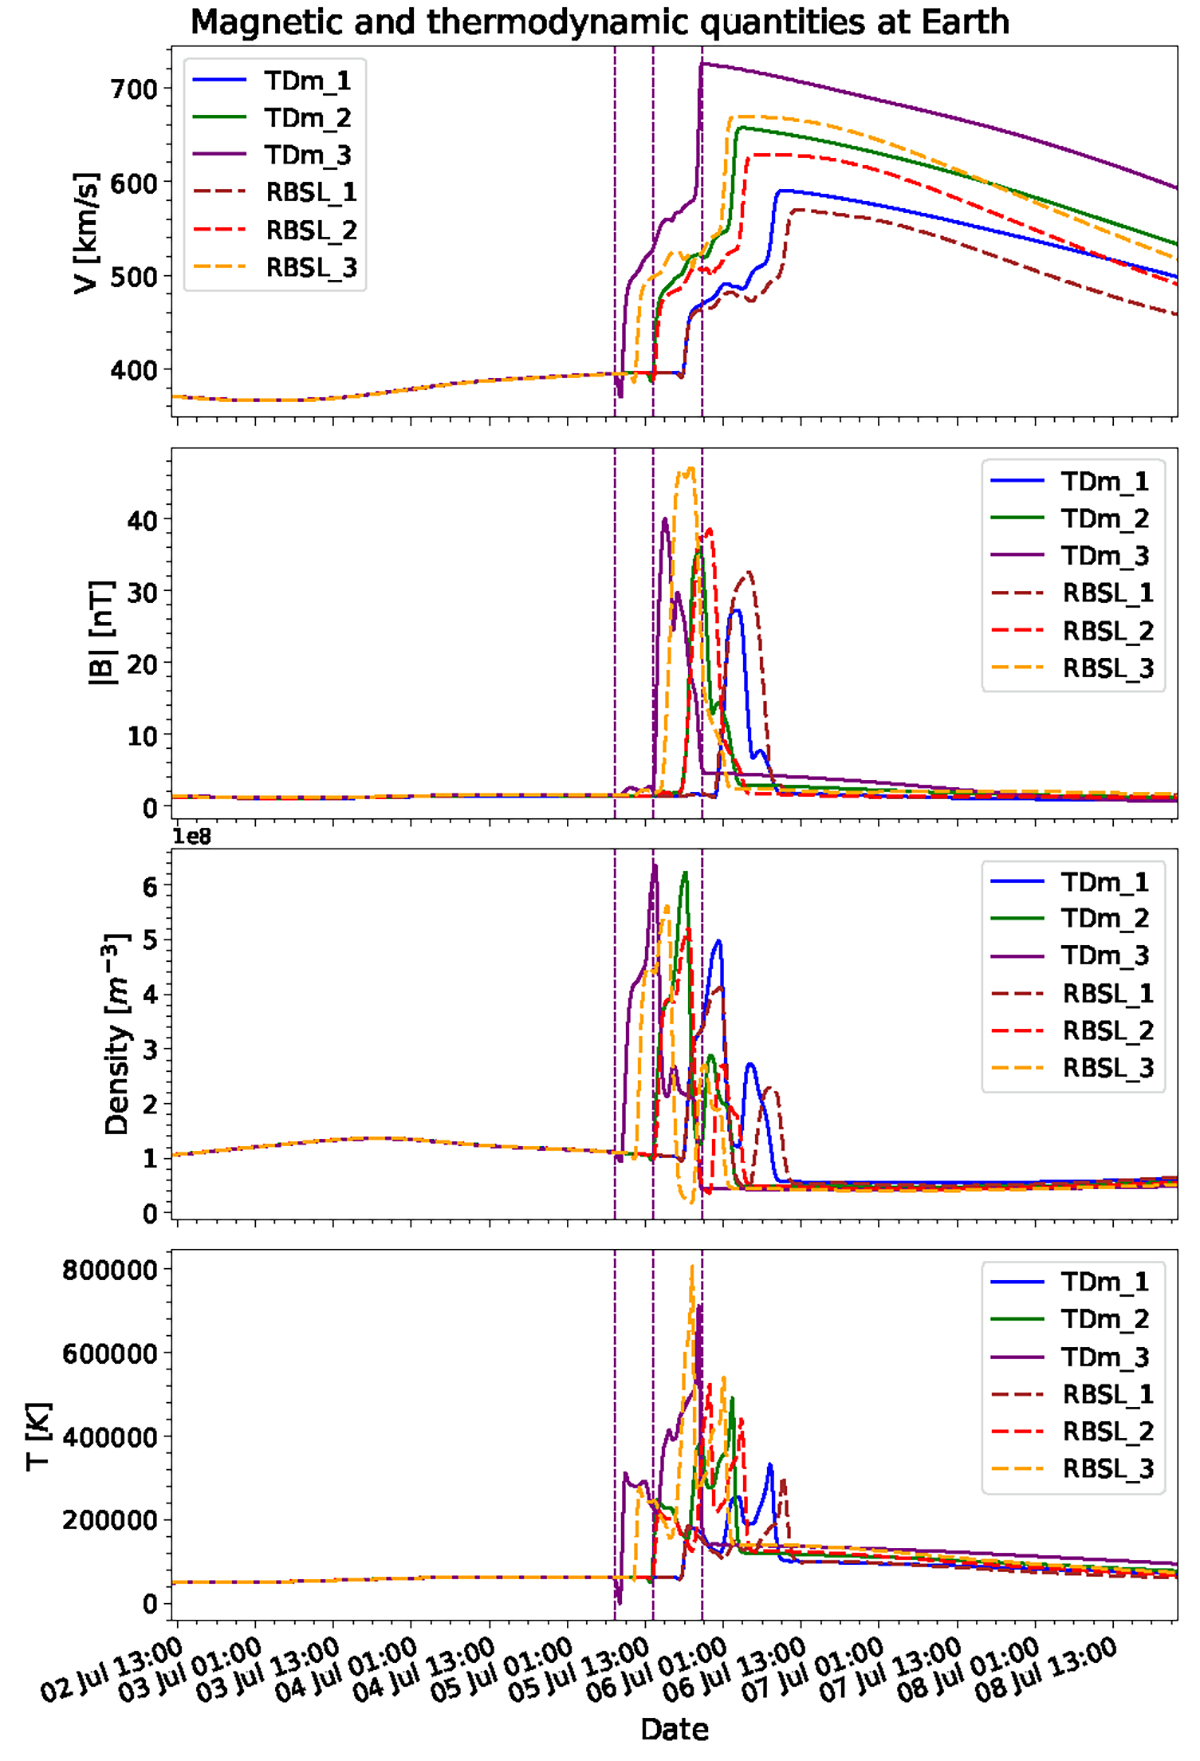
Fig. 12.
Download original image
Evolution of Earth’s magnetic and thermodynamic quantities in EUHFORIA. From top to bottom, the figure shows the profiles of the total velocity in km/s, the total magnetic field in nT, the density in m−3, and the temperature at Earth as predicted by EUHFORIA. Each coloured line represents a different simulation, as in Fig. 9 and the purple vertical lines approximately mark the start of the sheath, the beginning of the ME, and the end of the ME for the simulation named ’TDm_3’.
Current usage metrics show cumulative count of Article Views (full-text article views including HTML views, PDF and ePub downloads, according to the available data) and Abstracts Views on Vision4Press platform.
Data correspond to usage on the plateform after 2015. The current usage metrics is available 48-96 hours after online publication and is updated daily on week days.
Initial download of the metrics may take a while.