Fig. 11.
Download original image
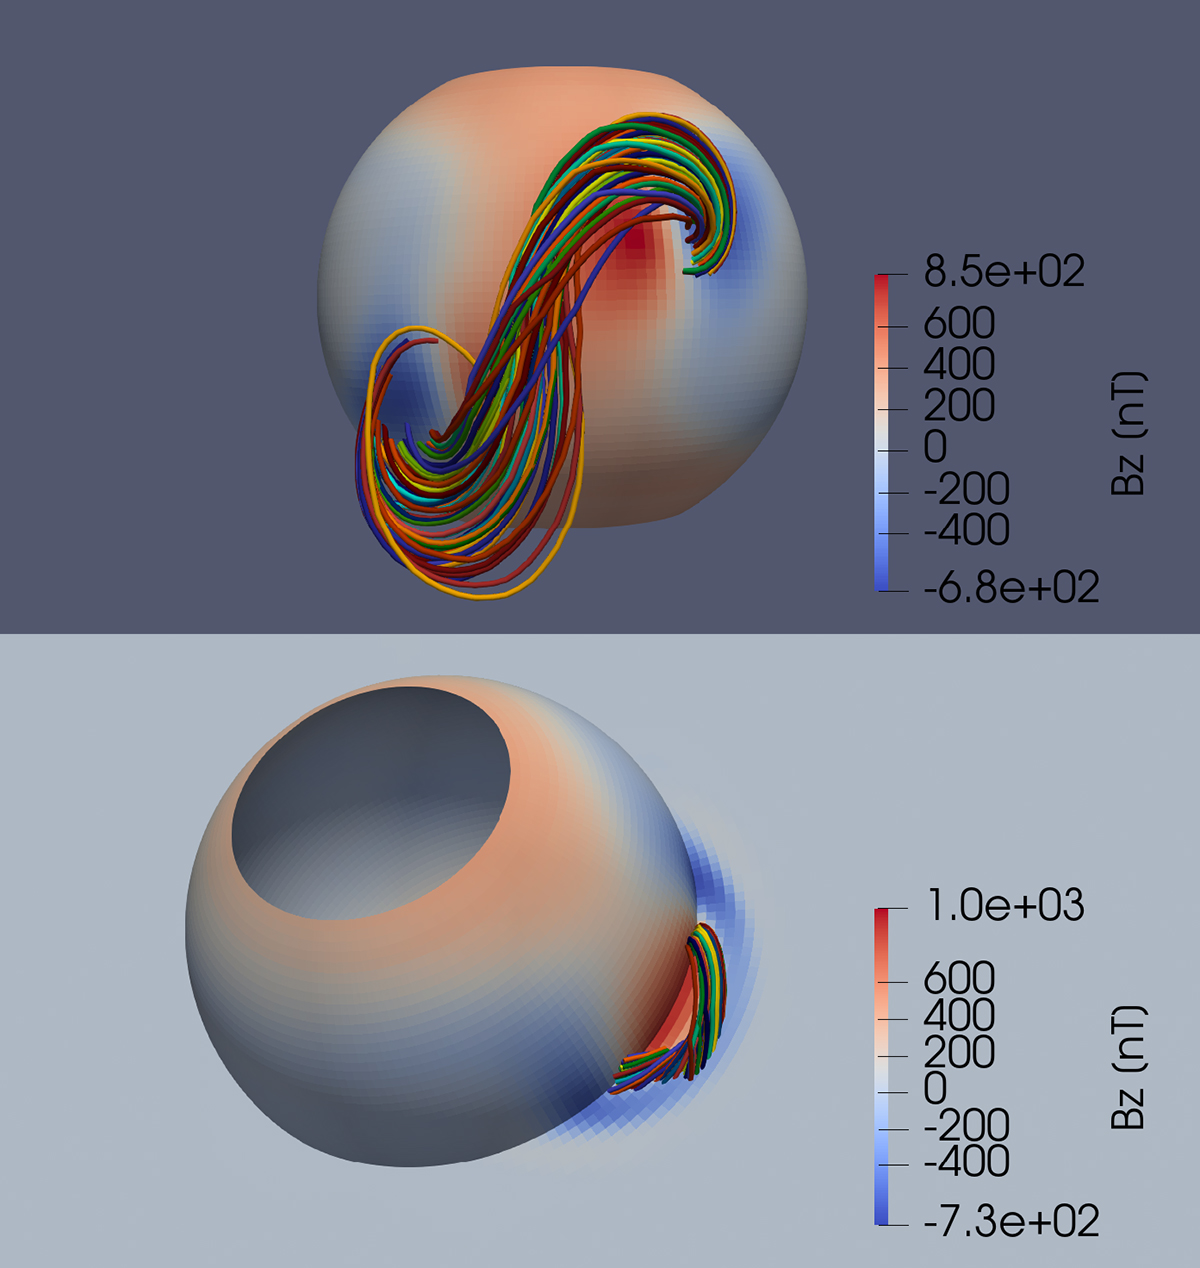
Visualisation of the TDm flux rope model and the RBSL model in EUHFORIA. The upper panel shows the CME model for the case named the case named ‘RBSL_3’, while the bottom panel shows the simulation with the case named ‘TDm_3’. The coloured lines represent a sample of magnetic field lines from the flux ropes. The 3D sphere represents the inner boundary of EUHFORIA at Rb = 21.5 R⊙. For the TDm simulation, the equatorial plane shows the Bz magnetic field component in nT.
Current usage metrics show cumulative count of Article Views (full-text article views including HTML views, PDF and ePub downloads, according to the available data) and Abstracts Views on Vision4Press platform.
Data correspond to usage on the plateform after 2015. The current usage metrics is available 48-96 hours after online publication and is updated daily on week days.
Initial download of the metrics may take a while.