Fig. 10.
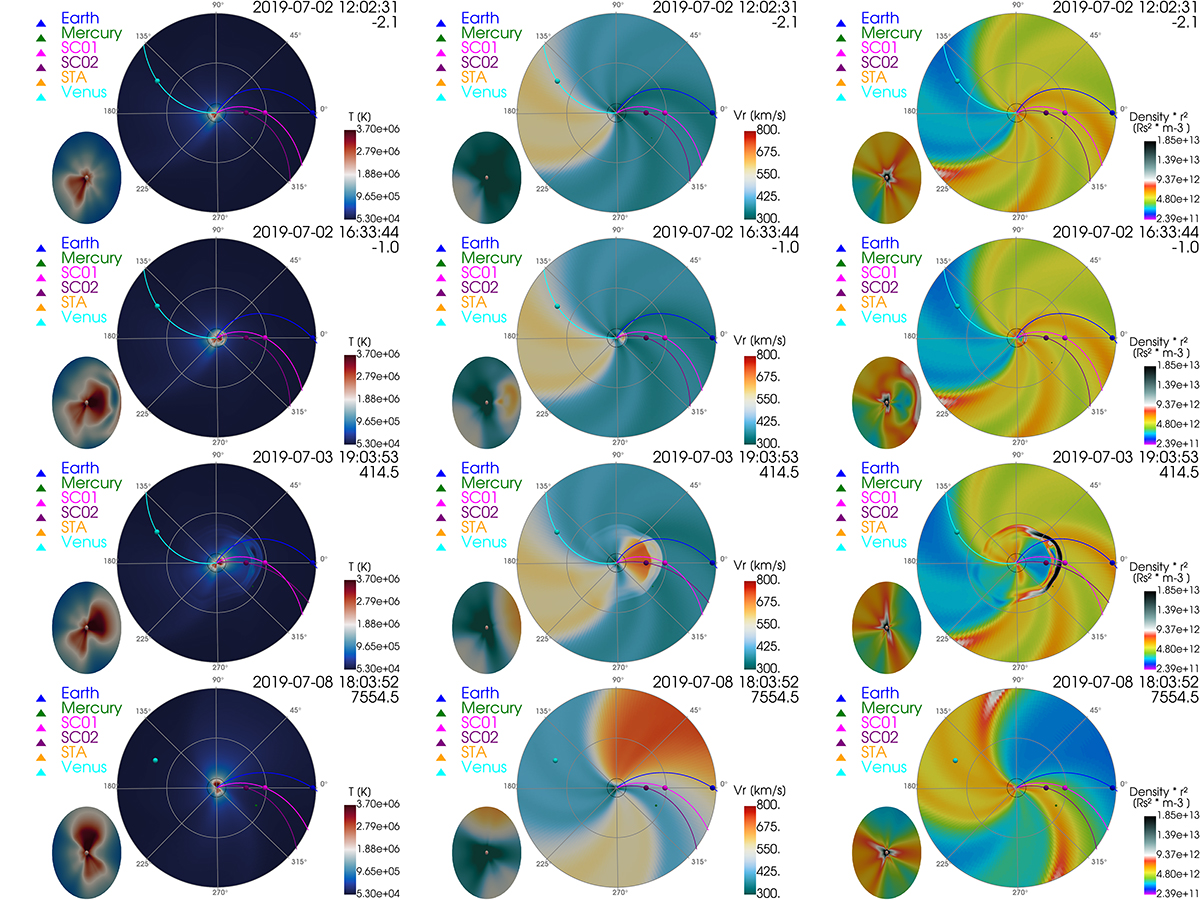
Download original image
Composite visualisation of the equatorial plane from COCONUT and EUHFORIA. Each panel contains two parts. The inner disc is delineated by a black circle derived from COCONUT’s output, while the rest is obtained from EUHFORIA. The region covered by COCONUT is also shown in the bottom left corner of each panel. The left panels represent the temperature distribution in Kelvin, the middle panels represent the radial velocity distribution in km/s, and the right panels represent the density multiplied by the square of the radius. From top to bottom, various time snapshots from EUHFORIA are presented. The number below the date in the top right of each panel indicates the time difference in minutes between the EUHFORIA and COCONUT timestamps. Each panel includes markers at the positions of different planets, virtual satellites, and the Parker spirals connecting them to the Sun.
Current usage metrics show cumulative count of Article Views (full-text article views including HTML views, PDF and ePub downloads, according to the available data) and Abstracts Views on Vision4Press platform.
Data correspond to usage on the plateform after 2015. The current usage metrics is available 48-96 hours after online publication and is updated daily on week days.
Initial download of the metrics may take a while.