Open Access
Fig. 7.
Download original image
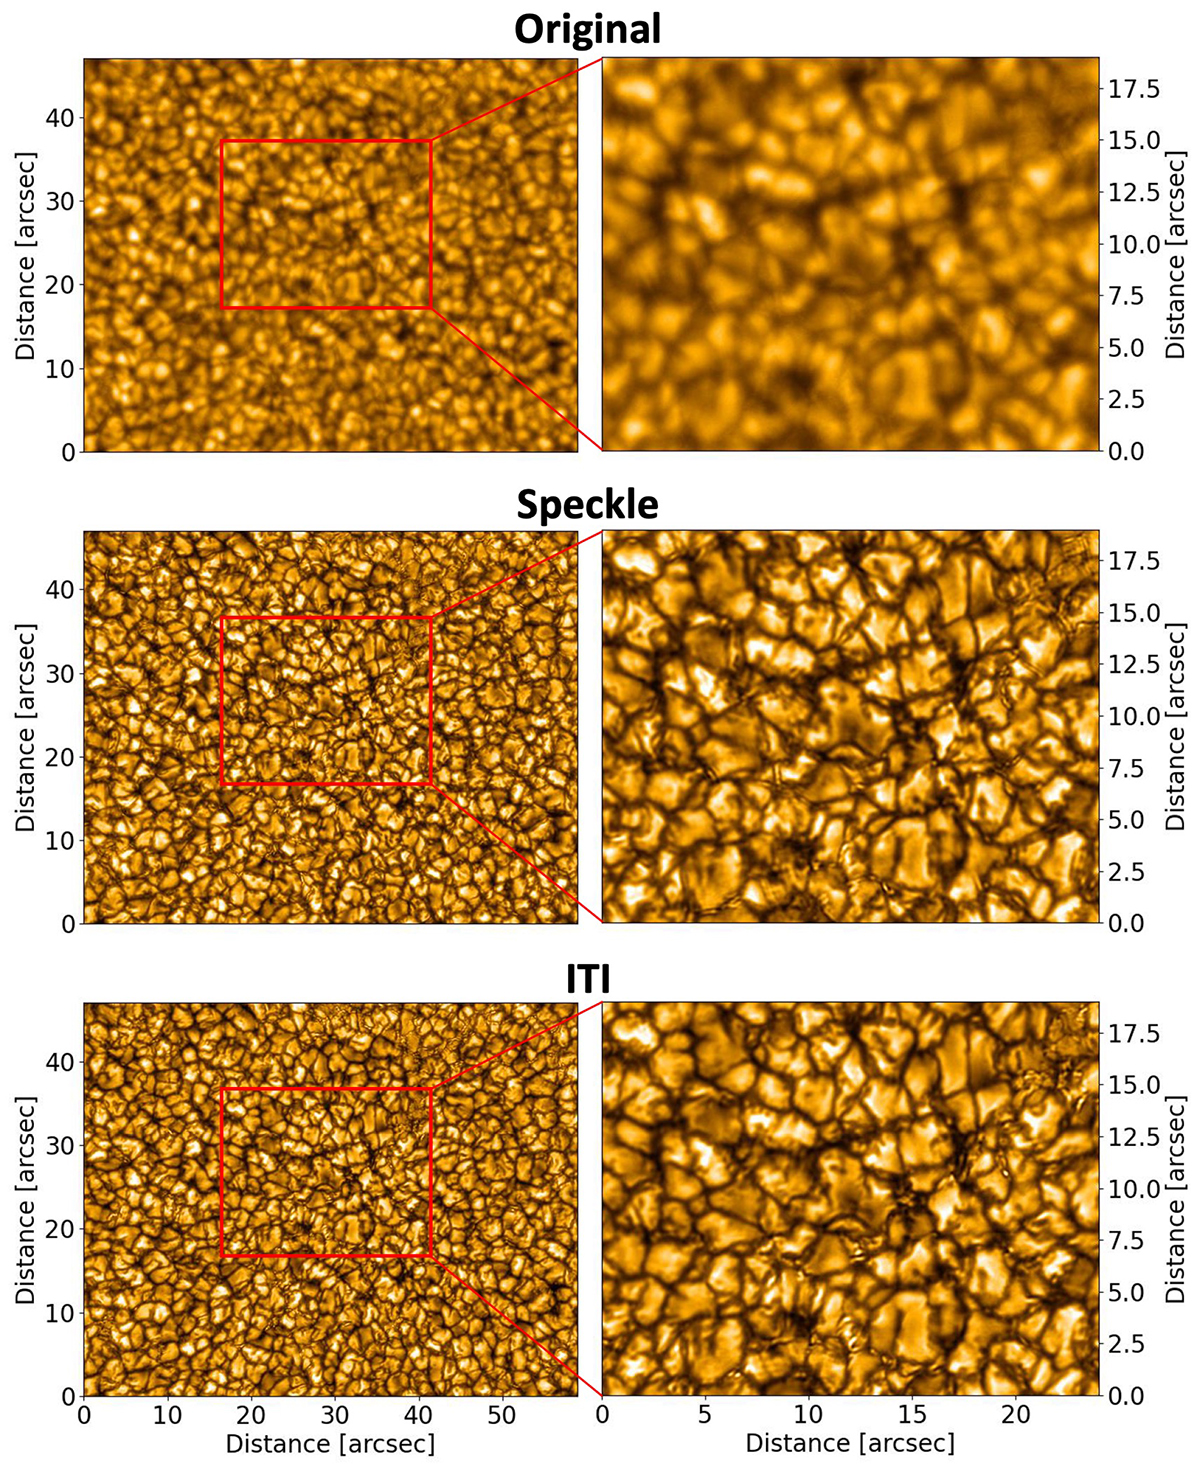
Visualization of a single frame from the original image burst on 13 June 2019 in the first row. The second and third rows show the speckle and ITI reconstruction, respectively. The first column shows the full-resolution observation, and the second column presents a zoomed-in view of the area marked with a red rectangle.
Current usage metrics show cumulative count of Article Views (full-text article views including HTML views, PDF and ePub downloads, according to the available data) and Abstracts Views on Vision4Press platform.
Data correspond to usage on the plateform after 2015. The current usage metrics is available 48-96 hours after online publication and is updated daily on week days.
Initial download of the metrics may take a while.